The Beginning of the Correction?
This post will be short and straight to the point.
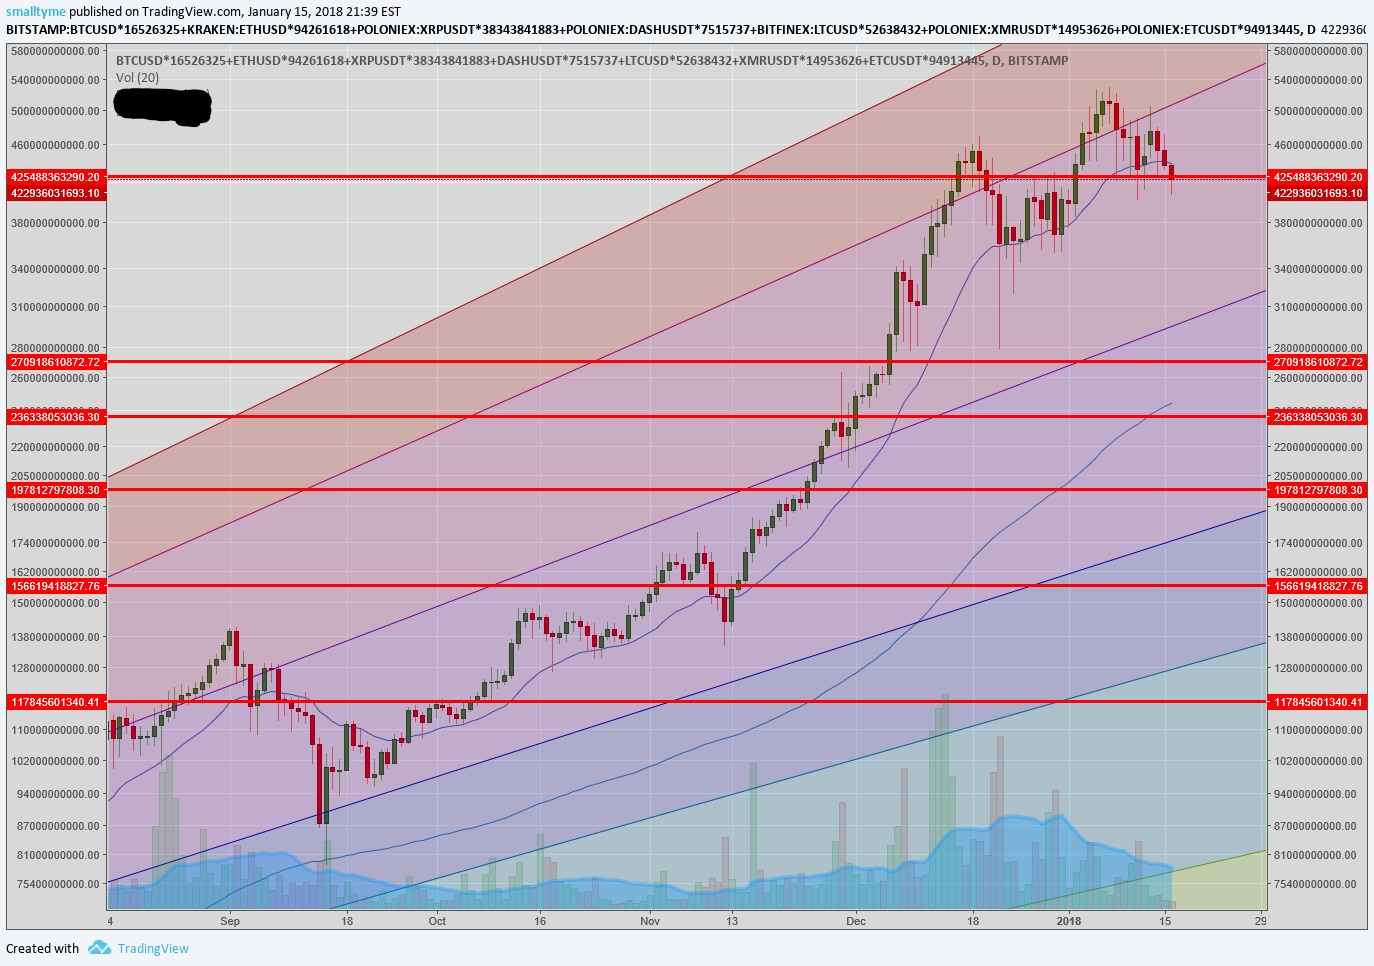
I moved out of all my positions this evening when I began to see a pattern with all my holdings and a proxy I use to indicate the entire cryptoverse (blockchain) marketcap.
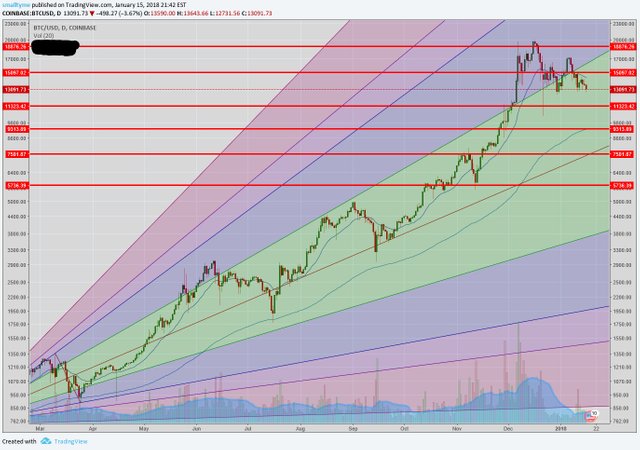
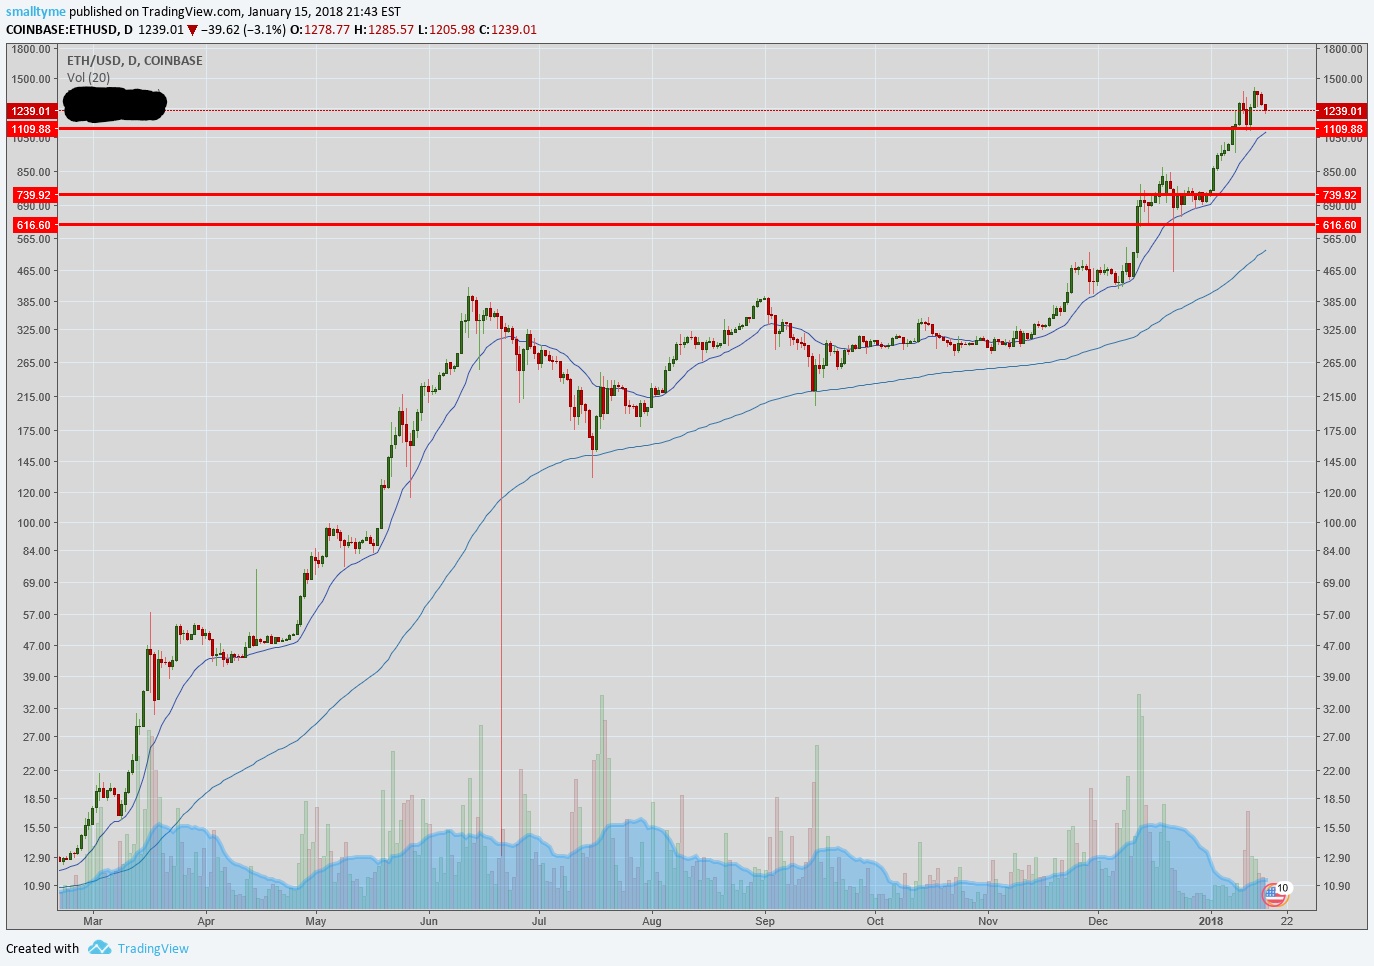
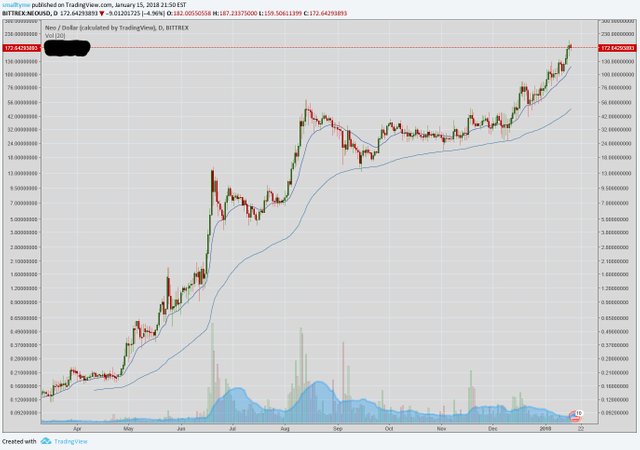
It seems to me that the price movement is falling from the short term average, to a longer term one, as it often does in a correction. I'll attach a few graphs here for you to draw your own conclusions. Of the major ones, the only ones that seems to defy this generalization are NEO and ETH which are both still at a price point above the short term average. Perhaps the continual proliferation of ICO's this year has something to do with the price movement, but the current behavior of both platforms is certainly interesting.


I said at the beginning of the post that I have moved to an all cash position, so even if it takes a month or two for a correction to occur, I will wait for the opportunity to re-enter the space.
I haven't forgotten about the detailed posts regarding the coins listed in my previous post. While the prices have decreased (some significantly) since the post, I will point out that the premise behind those coin picks is an increasing overall cryptocurrency market cap; this has not been the case.
As usual, this is not investment advise. I am simply stating what I have done and what I hope to do. Invest your money wisely and only what you can afford to lose. I cannot predict the future and just because it looks like prices are falling does not mean they will. They very well could reverse in the next minute. I cannot see into the future.
Also , if my charts look unusual, it's because I prefer the logarithmic scale.