The Inverse Correlation of Gold and Bitcoin Can Be Useful for Traders | SimpleFX Blog

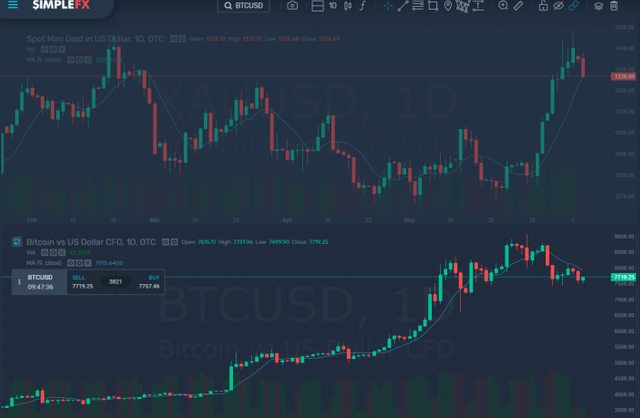
The gold rally (a safe-haven in terms of assets) is causing a downward pull on Bitcoin again. At the end of May, the cryptocurrency reached a peak of almost $9,100 only to hit a low again of $7,432, the lowest point in the last two and a half weeks, on June 4 th .
This pullback was no unexpected as bullish exhaustion was being reported on the technical charts. In spite of everything, rallied in May, decoupling from the equity markets by almost $4000.
This correction is worthy of note given that it is tied with a strident rally in the prices of gold. The metal had a bid price of $1,275 an ounce at the end of May and then climbed a further $69 to $1,344 an ounce on Wednesday. This is the highest since February 20 th .
Since the last quarter of 2018, this inverse relationship has been evident. In mid-November, BTC below the support of $6,000 and revived the bear dropped sharply market. The market had come to a standstill around the psychological support in the five months leading up to October. By the middle of December, 15-month lows were being traded for BTC, near to around $3,100.
At this very same time, gold jumped to $3,100 from $2,100 and then extended the rally further to the February 20 th high of $1,346.
By the beginnings of May, gold was down by roughly 6% from those February highs. BTC was trading at around $5,500 at this point, which represented a 76% rise on their lows of December that was near to $3,100.
In May, this inverse correlation became somewhat weaker. Gold traded in the region of $1,300 to $1,270 amidst the sharp increase to $9,000 from BTC.
Both assets are now moving divergently again, as previously mentioned. It’s noteworthy that this correlation does not, therefore, imply causation.
The recent rally of gold is likely to be associated with the markets pulling forward the Fed Reserve interest rate cut. For example, the likelihood that the Fed will cut interest rates next month increased to 72% earlier in the week. This is up 42% from early May. Furthermore, the futures market for Fed funds is now coming in at three cuts in rate for 2019. Again, this correlation doesn’t imply causation. While gold (an asset with zero yield) is looking at increased chances of a reduction in the borrowing costs of the US, Bitcoin takes a hit, most likely due to the factors driven by the charts,
Having said that, this inverse relationship needs attention. The possible toppy price behavior in gold might be a warning of Bitcoin’s bullish reversal.
Originally published at https://blog.simplefx.com on June 10, 2019.
Thank you for an interesting article. I would like to read if there is any fundamental basis, which would explain the correlation more in detail than just a simple matter of similarities in what both can be used for.
Hi,
Thank you for your feedback. I advise you to follow our blog - https://blog.simplefx.com/
We are doing our best to create the best articles :)
Wish you all the best!
SimpleFX Team
Hi,
Thank you for your feedback. I advise you to follow our blog - https://blog.simplefx.com/
We are doing our best to create the best articles :)
Wish you all the best!
SimpleFX Team