BTCUSD Vs. BCHUSD - how do we discern intrinsic value?

Network Hashrate - what does it really mean?
Something a little bit different today as I maintain my bullish stance on BTCUSD. In fact buy up all you can because when the CME suddenly hosts futures trading in mid December, wall street is allowed to play. I predict that the market cap of bitcoin will double as this is rolled out - that's right! I think from 100 billion to 200 billion dollars in short order.
Now to be clear I don't care one way or another for an investment vehicle, they are great till they are not. So BCHUSD was great for a few days, not looking so hot now as it tests the 1k level after an extremely bearish reversal candlestick marked the top. This is a reversal hammer that saw the price pullback from nearly $2800 all the way to $1500 and continues its decline back to test the $1000 mark.
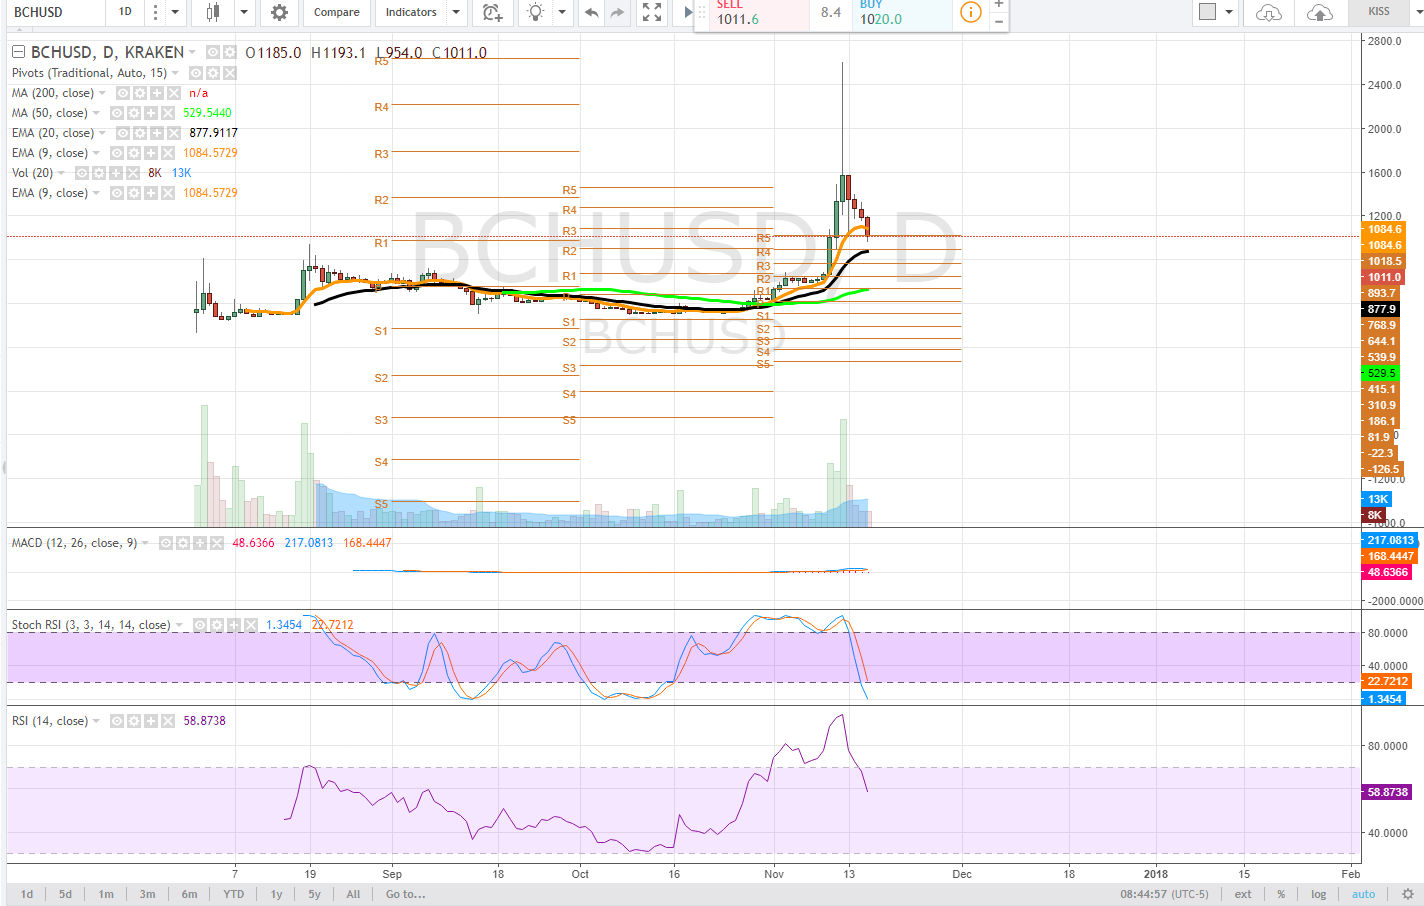
During the spike in BCHUSD, beloved Bitcoin tanked, from $8000 to $5500, give or take. Not only was this a Fibonacci support from the previous low, it was a psychologically important level and in my opinion a necessary retrace of the price.
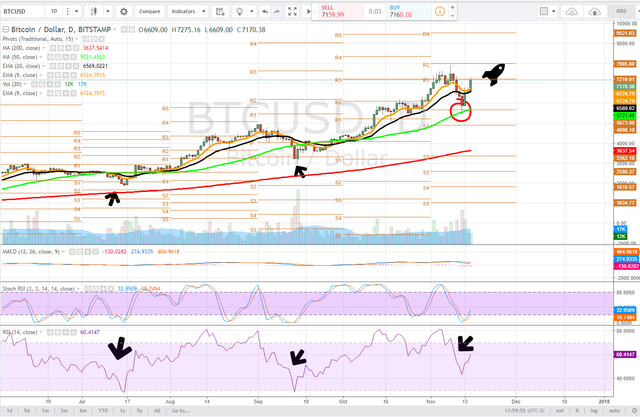
If you were quick, affluent or following along with my trade setups you would have bought bitcoin during that bounce off the 50dma (green) and be laughing all the way to the bank... err wallet. This price fluctuation and inverse correlation created fantastic opportunities to play the altcoins, some playing bullish, others shorting the top of the likes of ETH DASH LTC XMR in their BTC pairings - to make more BTC. 'Gosh,' this was quite a bit of action and if played careful, very profitable.
So Why did it Happen
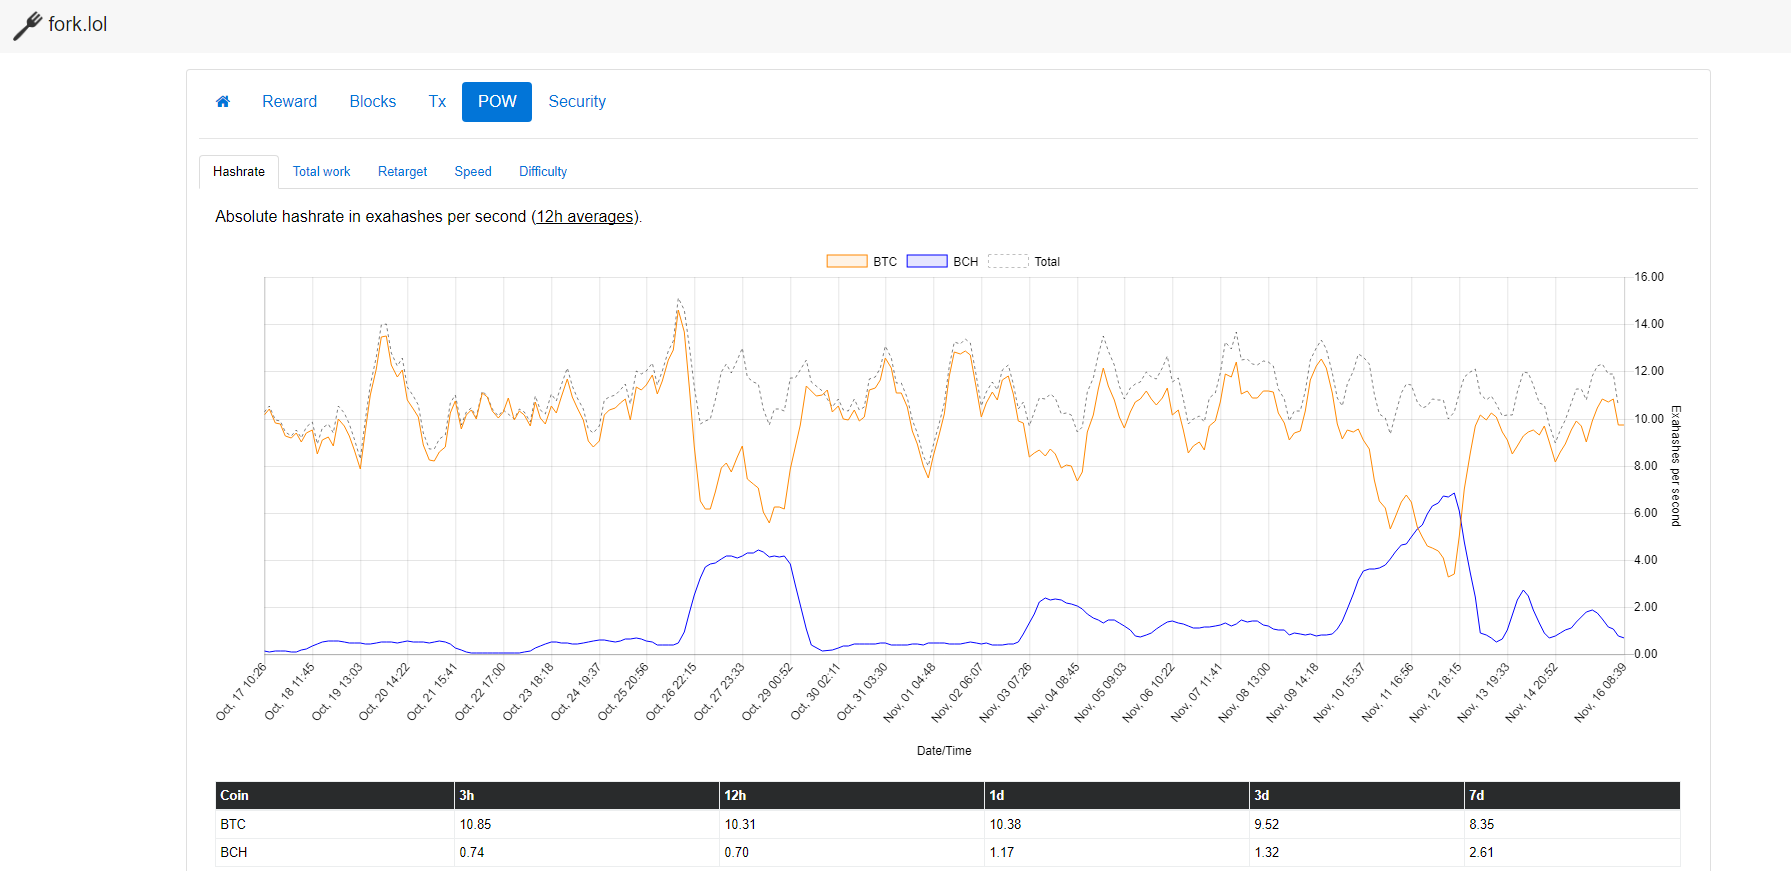
Network Hashrate, that's why this happened.
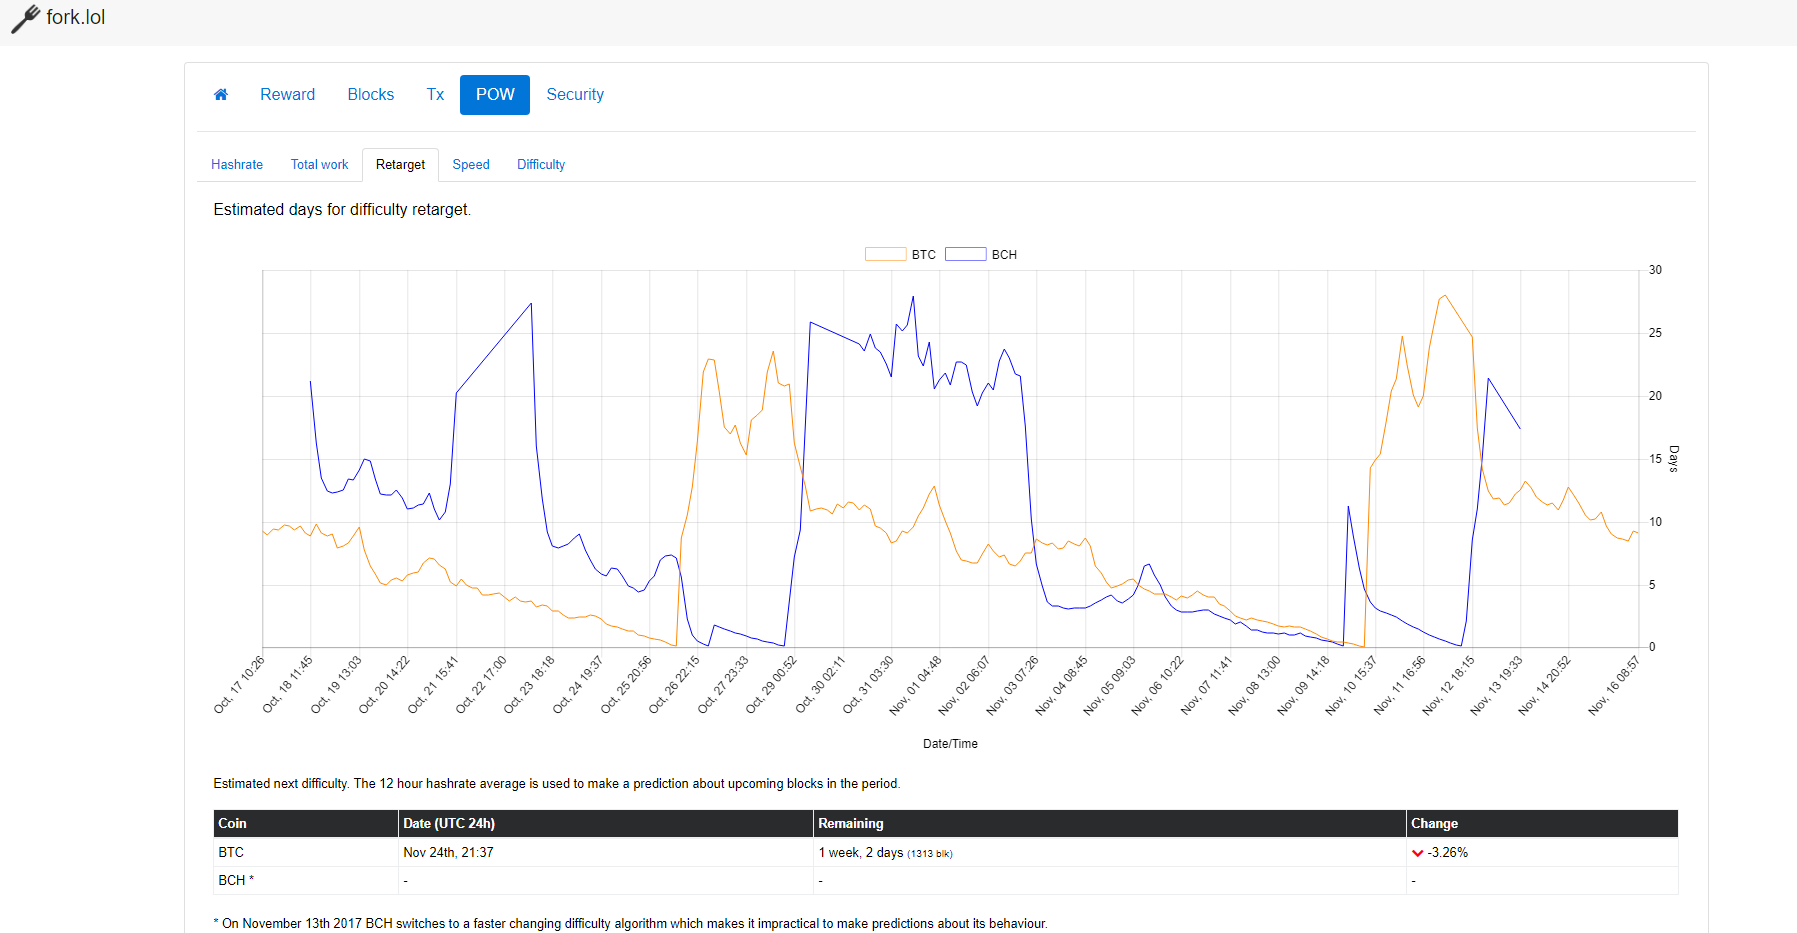
If compared to the charts it is clear how the network hash rate correlated to price. In fact, during the switch to mine BCH, bitcoin transactions virtually stopped... not virtually, they did for nearly 24 hours. Because of this people began selling off their bitcoin, but generally speaking we don't have the ability to discern how much of the pullback was a result of selling pressure vs. the falling network strength.
How did we know the bottom was coming for BTC and Top for BCH was about to be set?
We could see when the difficulty was going to retarget and when it did, BCH was suddenly almost 40% more difficult to mine than BTC. It was really a no-brainer to predict a 'flipp-en-ing' of network strength back to BTC and suddenly transactions were working again a bottom got set and bitcoin moonshot its way back to the $7000's in classic bitcoin style.
We want Charts!??!
Okay okay, we will do a quick analysis of the daily chart on BTC.
Posted Yesterday

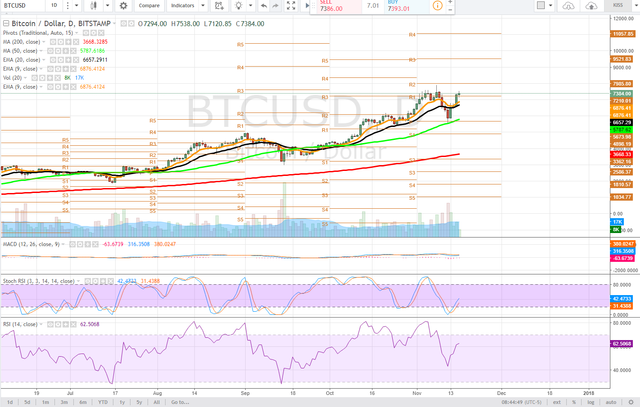
Looking at the chart we could see everytime the RSI corrected on BTC the price would at least test the 50dma (green line) if not fall under it for a short period. Noticing that the RSI had begun correcting with all of this miner and network hash business, our clear target was again the 50dma. Traders or those practiced would have known this to be a buying opportunity, it's moving average trading - this, of course, would assume you didn't believe that this was the end of bitcoin and weren't risk averse. Chicken little doesn't make money.
Currently, Bitcoin has formed what is known as a V bottom - which is characterized by a steep decline that is matched with an equal and opposite angle of ascent from the time the bottom is marked. The massive wick on that daily candlestick makes this fit perfectly into that definition.
Bitcoin Today

On today's chart, as predicted yesterday the price has claimed pivot R1 as support and has reached previous highs, we may push higher immediately to match the wick at $7886, but more likely there will be a period of consolidation here before continuation. Either way, it is a perfect setup for our V bottom reversal to form a bull flag, signaling higher.
So what does this have to do with intrinsic value?
Well much like gold, the value of a commodity and yes, bitcoin is a commodity, is determined by the support and belief of its community. Community support + functionality are the lifeblood of cryptographic assets and in fact, work in tandem. The miners are a huge part of the community that supports the asset. If a network goes down and stays down, the asset is useless - much like bitcoin was for 48 hours.
If suddenly everyone decided gold was just a paperweight, not a store of value of safe-haven commodity, it's value would drop to the equivalent of concrete or gravel. Companies mining it would seek out a more profitable resource - which is what happened to bitcoin and bitcoin cash for a short period.
Cryptographic assets will work in much the same way. We will see coins drop off as their networks fail, we will see communities give up on their beliefs.
So next time something crazy is happening to the network hash rate of a coin, be on guard, follow the miners, keep an eye on retargeting and trade or invest intelligently. Oh, and if you land on the right side of a parabolic move, lock those gains in and use stop losses because just the same, it could all be momentary and fleeting, which it often is. If you miss a move, wait, wait for a reversal, be calculated and never chase... chasers got trapped at $2700 bch.
Currently - Stay long BTC adding on dips into December launch of the CME Bitcoin Futures. $100 billion dollars is peanuts to wall st. The CME is an internationally recognized institution in capital markets - wall street will play whenever there is money to be made.
Previous Articles:
BTCUSD
BCHUSD
BTCUSD
ZECUSD
XRPUSD
ETHUSD
BTCUSD
BCHUSD
Follow at your own risk, Not a financial adviser, understand the risks associated with trading and investing. Manage your own Risk - in other words you could lose it all and it's your own fault.
I agree 90% with you; but you should be careful in your analysis of Bitcoin, better bet on Bitcoin Cash, I think it will be the cryptocurrency that will increase 100% the price. I did a predictive analysis on Bitcoin too.
It is in Spanish: https://steemit.com/miercolesanalitico/@josevasquez/trampas-del-bitcoin
It is in English: https://steemit.com/miercolesanalitico/@josevasquez/bitcoin-traps
Have exposure to both if you think so. I personally am just following the money and if people think $100 billion is a lot, just wait till the CME opens the crypto floodgates to wall st.
Good analysis and info. Great post! @satchmo.
@satchmo you do bad ass analysis, love & follow!
Ha thanks!
Very good analysis @satchmo . I see abc correction done and we have now a strong uptrend impulse. BTC will see 8k this month and testing near 10k this year.
Its interesting actually because the futures on bitmex actually hit 10k on the first spike towards 8k. Price should consolidate now, looking for a bull flag range here all the way to 7200 ill add.
Charts on hashrate were key to predicting what the outcome of the flippening was going to be.
Needed you to post this last Thursday, not after all the drama was over, :)
I did actually in an analysis of both bch ans btc 🍆
😃
https://steemit.com/crypto/@satchmo/btcusd-technical-analysis-november-11-2017-current-price-usd6100
Great article. Do you know exact date of CME Bitcoin Futures launch?
All the CME head has indicated is mid december. An important note was made by wall st cronies aboit making sure crypto is sort of quarantined from the rest of their operations due to the volatility it is thought that it could affect theor capital reserves
Awesome post, you have a new follower @satchmo
Learned much from you, friend, thanks! Following you.
Impressive and solid analysis ... i am also of the opinion that BTC LONG ....Lets see where BTC take us on the other way ....anyway good analysis done

very nice and informative post, dear @satchmo do you have any idea for BCH Price at the end of 2017?
price target = $600 .. its going to fluctuate violently -- good for trading.
thank you