A possible Inverse Head & Shoulders Pattern on Bitcoin Charts
Though I still stand by my view that we may test the $7000-$7500 zones once again before we go bullish again, there is a possible Inverse Head & Shoulders Pattern developing on the Bitcoin Charts.
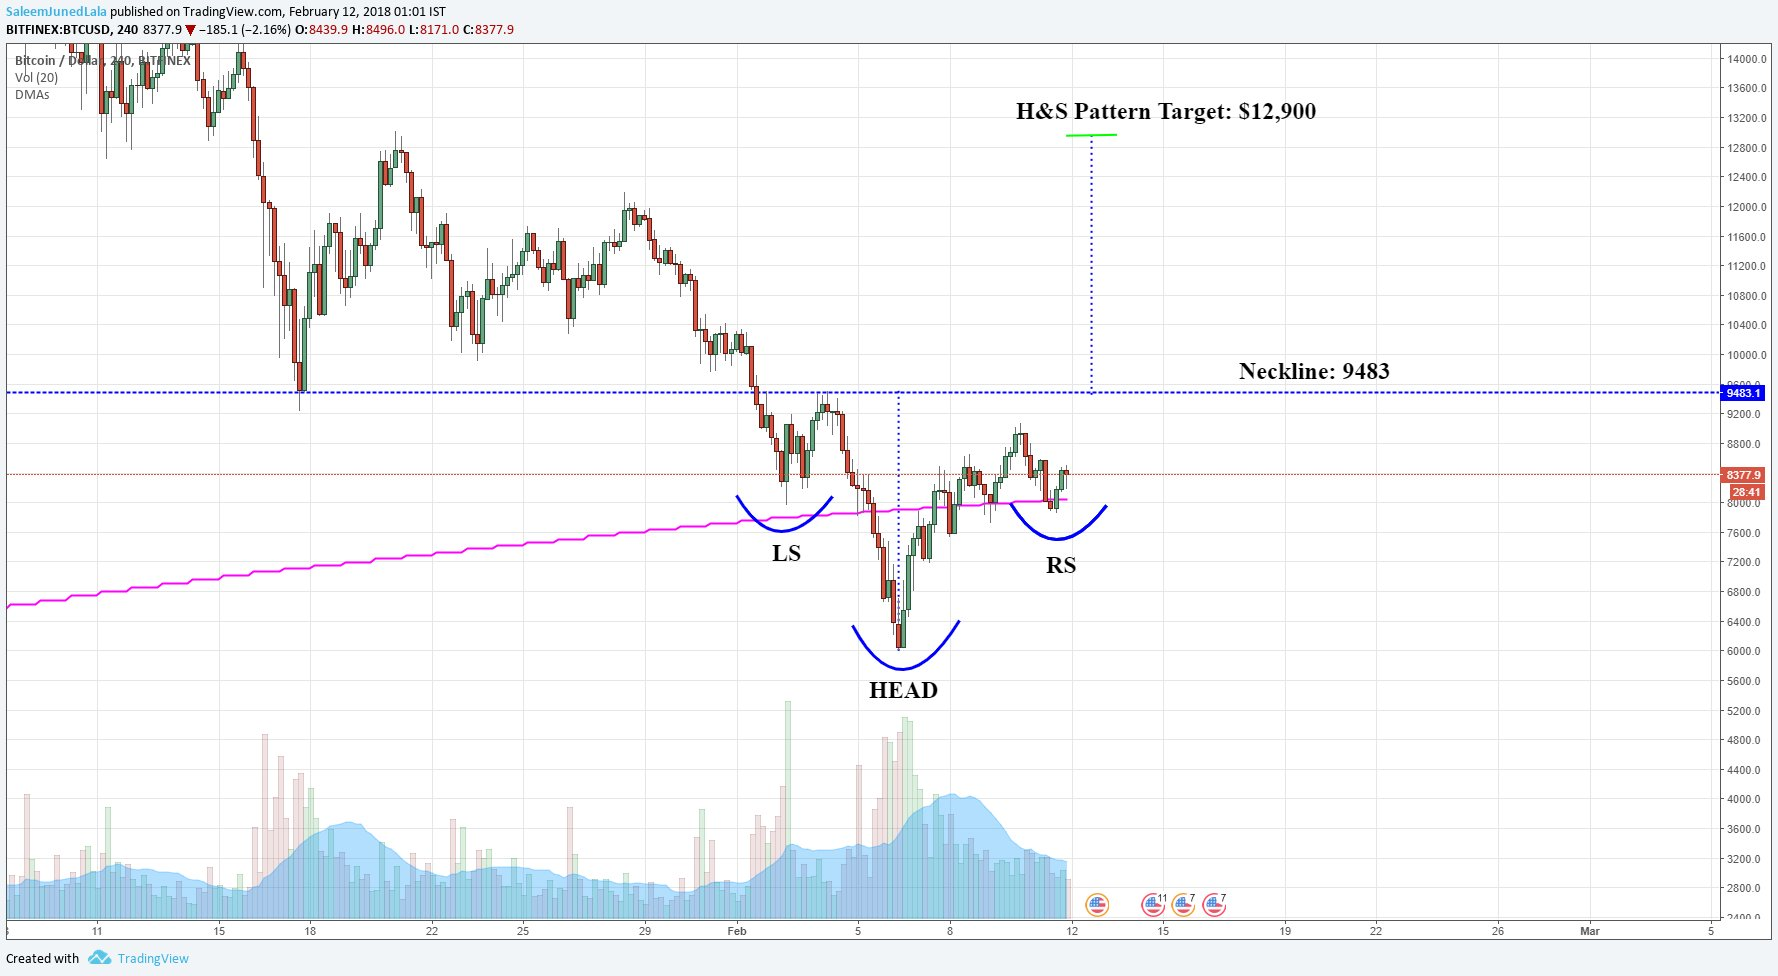
This may work out well, and if it does, we may see $13,000 levels soon! Let's see
Follow me on Twitter for more updates.
If you agree with my views & benefit from them, make sure to upvote & resteem. Please leave your comments as well with any suggestions and views you may have.
Lets pray!
Upvoted ☝ Have a great day!