Bitcoin (6/12/2018): Descending Triangle, Further Drawdowns, and Consolidation
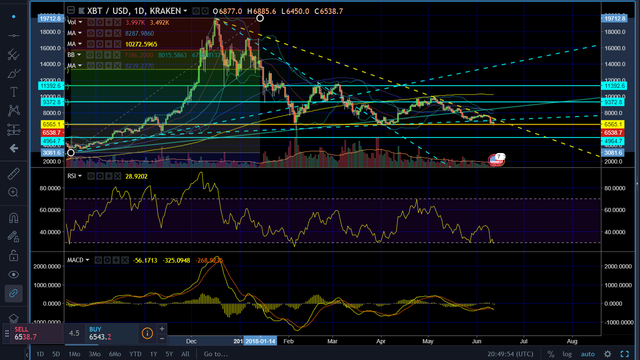
We are on Tradingview.com taking a look at the XBTUSD Daily, H4, and H1 charts. The price is in a very interesting zone. If we take a look at the daily chart you can see a descending triangle pattern (marked with yellow lines). The descending triangle pattern is a bearish pattern indicating the price will continue in that direction(if we are just going off pure Technical Analysis), the ascending triangle is a bullish indicator that price will continue to ascend. Some patterns that are similar to the triangle are the ascending and descending wedge patterns which indicate that the price will reverse directions. You can learn more about triangles and wedges by visiting the forexabode.com link at the bottom.
If we take a look at the chart we can also see the price is retesting the 78.6% fibonacci retracement level using September 2017 lows and the 2017 December highs. That would be about $3000 USD in November and about $300 dollars shy of 20k. You can learn more about fibonacci by visiting the babypips.com link at the bottom. 
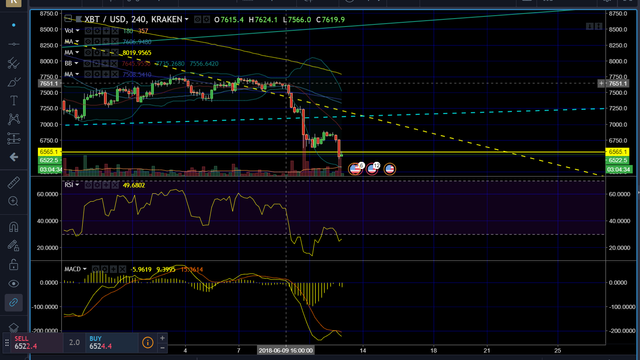
If you look at the intraday charts you can see indications of further downside. Here is the 4-Hour Intraday chart and we see the price has broken the 78.6% level of support. 
In other words BTC is still in a range of consolidation, there will be further downside for the next few days or some weeks, do not be surprised if the price tests the $5500-5000 USD levels. It will get a little darker before it gets light. Bitcoin is simply lacking the volume and excitement it had before the beginning of the year. Some of us are in this for what money can't buy and are not so concerned with the constant price fluctuations of Bitcoin and other cryptocurrencies. If you want to make money consistently get into cryptomining or learn how to trade forex. If you are interested in learning about any of those drop a comment and let me know, as I am trying to find a way to be consistently useful to the Steemit community. Okay, guys Happy success until next time.
Trying to bring that fire...
Technical Analysis is an art not a science...
None of this is investment advice and should not be taken as such...
I posted a gold link, we can talk later...
http://www.forexabode.com/forex-school/watch-out-for-patterns/difference-between-wedges-and-triangles/
https://www.babypips.com/learn/forex/combining-fibs-with-support-and-resistance
https://karatbars.com/index.php?page=signup
http://a1leathershop.com/
Congratulations @rubix! You received a personal award!
You can view your badges on your Steem Board and compare to others on the Steem Ranking
Vote for @Steemitboard as a witness to get one more award and increased upvotes!