Bitcoin Charting Update #1
Hello everyone!
I just updated my idea on Bitcoin price movement.
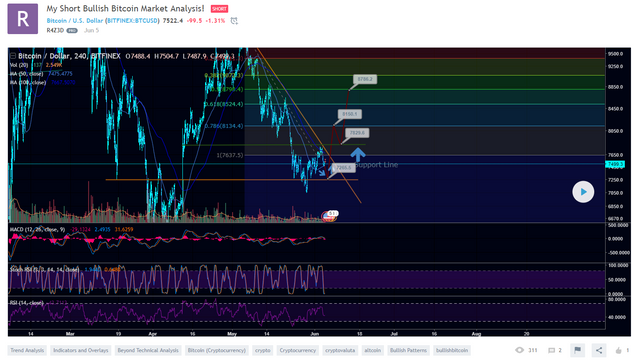
"On the 1HR RSI/StochRSI we are oversold, that may mean that we are going to re-test the resistance level.
On the 4HR chart, the MACD is still in the +, Stoch RSI high and RSI is @ 47.
Imho 1) we are going to either drop down now
2) We are going to re-test the resistance and fail at it
The RSI sure is 47, and that's low. But we have been oversold like 30- and already been at 37 RSI, and so MACD in +, Stoch RSI highly oversold and RSI 47, just 10 points above the previous one, I think it's fair to assume that we are going down to the support level."
If you enjoyed my post, please give it an up vote and drop a follow!
Commend down below, what do you think? Are you headed down to lower 7K$ levels?
Congratulations @robust-crypto! You have completed some achievement on Steemit and have been rewarded with new badge(s) :
Click on the badge to view your Board of Honor.
If you no longer want to receive notifications, reply to this comment with the word
STOP