Weekly analysis of the bitcoin course. 19-25.02 #1

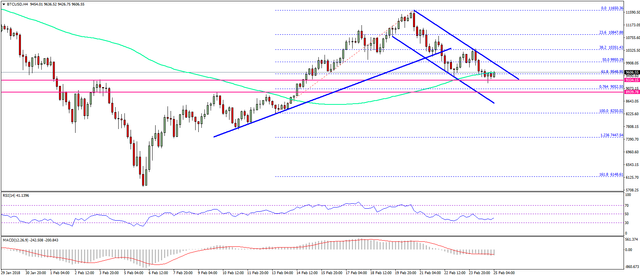
Let's talk about the bitcoin course. Last week, it fell below $ 10,000 after the support of the upward trend line broke through at $ 10,350. The BTC / USD pair will have to hold above $ 9,300 and $ 9,000 in order to avoid further decline.
Last week, there was an increase in pressure on the bitcoin rate. The course began to fall. 23.6% of the Fibonacci retracement from a minimum of $ 8,250 to a maximum of $ 11,650.
After that, there was a drop below $ 9,400, skipping the support of a simple moving average for 100 days on a 4-hour chart. Also, the 50% Fibonacci retracement line was broken from a minimum of $ 8,250 to a maximum of $ 11,650, thereby leading to a further drop below $ 10,000. On the other hand, support was formed at $ 9,350. If this line is broken, the rate will drop below $ 9 000.

To return to the bullish zone, the bitcoin course will need to break through the resistance at $ 10,000.
The convergence / divergence of moving averages (MACD) is now in the bearish zone. The relative strength index (RSI) is below 50.
The main support line is $ 9,350, resistance is $ 10,000.
I like this post and I flw u :) plz flw me .
Don't miss out on your free crypto's worth $10-$25! join now and receive free crypto's for joining, invite your friends and youll receive additional 3-10 coins per invite (just copy and paste these links!!) https://discord.gg/fgTR5Rk
https://discord.gg/MpmEunG
https://discord.gg/vFjhpV
https://goo.gl/YKwNgs
https://discord.gg/atkMyQH
https://discord.gg/YJpChXJ
https://discord.gg/sQtrWB
You got a 7.32% upvote from @steembidbot courtesy of @reishark!