Bitcoin, Ethereum, Bitcoin Cash, Ripple, Stellar, Litecoin, Cardano, NEO, EOS: Price Analysis, April 11

COINTELEGRAPH
The future of money
Prev Next
Apr 11, 2018
Rakesh Upadhyay
By Rakesh Upadhyay
Bitcoin, Ethereum, Bitcoin Cash, Ripple, Stellar, Litecoin, Cardano, NEO, EOS: Price Analysis, April 11
19267 Total views 277 Total shares
Bitcoin, Ethereum, Bitcoin Cash, Ripple, Stellar, Litecoin, Cardano, NEO, EOS: Price Analysis, April 11
PRICE ANALYSIS
The views and opinions expressed here are solely those of the author and do not necessarily reflect the views of Cointelegraph.com. Every investment and trading move involves risk, you should conduct your own research when making a decision.
The market data is provided by the HitBTC exchange.
The analyst community in the form of large investment banks continues to view Bitcoin as a bubble, with some suggesting that it has burst. This, however, has not stopped the flow of talent from Wall Street to the Crypto universe.
Additionally, China, which has banned trading in cryptocurrencies is zooming ahead with the development of Blockchain technology. In a recent move, the Chinese government has launched a $1.6 billion Blockchain fund to support more projects and startups.
The European Commission has asked Europe to work towards playing a leading role in the field of Blockchain technology.
Japan leads the world in trading of cryptocurrencies. The Japanese Cryptocurrency Business Association (JCBA) believes that there are 3.5 million active traders in digital currencies.
Most developed nations are moving towards adopting Blockchain technology, which will be positive for cryptocurrencies in the long-term. The positives far outweigh the short-term risks.
Adrian Lai, founding partner of Hong Kong-based crypto investment firm Orichal Partners, believes that after the correction, 2018 will attract institutional investors, which will result in an increase in trading volume.
The second quarter of the year has traditionally seen a Bitcoin rally, evidenced by both 2016 and 2017. Will we see a repeat again this year? Let’s see what the charts forecast.
BTC/USD
Bitcoin has formed a descending triangle pattern in the short term, which will complete on a breakdown below $6,757.26. The previous two attempts by the bears to break this support failed on April 01 and April 06.
BTC/USD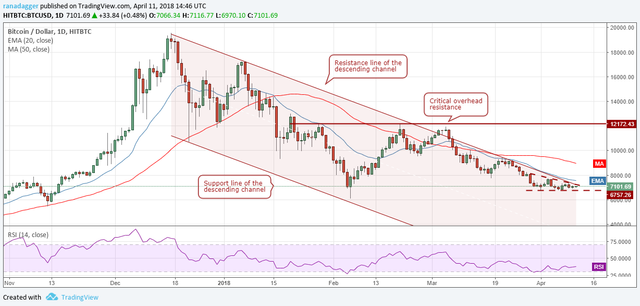
The bearish pattern will be invalidated if prices break out of the triangle, which is close to the resistance line of the descending channel and just below the 20-day EMA. Once price breaks out of these resistances, the BTC/USD pair will turn positive and rally towards the 50-day SMA.
Traders can initiate long positions on a close above the 20-day EMA with a minimum target objective of $9,000. The initial stop loss can be kept at $6,700, which can be trailed later.
Our bullish outlook will be invalidated if the price breaks below the triangle, which can result in a slide to $5,435.66 levels.
ETH/USD
Ethereum is trying to break out of the tight range it has been stuck in since March 30. On the upside, it has resistances at the 20-day EMA and at the resistance line of the descending channel.
ETH/USD
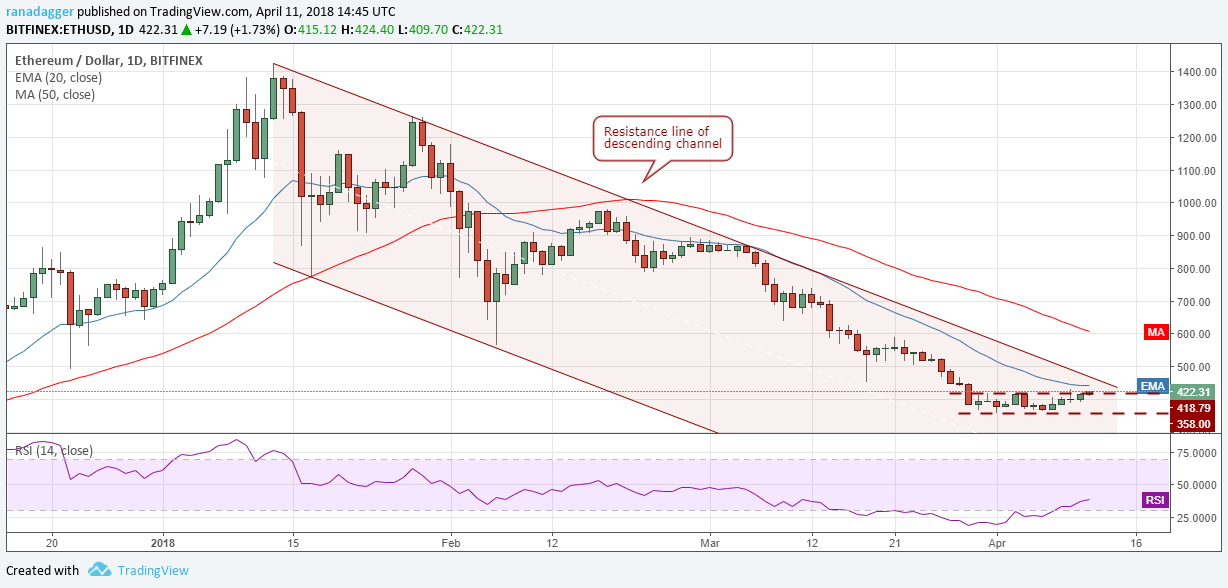
If the ETH/USD pair breaks out of all these overhead resistances, it will then rally towards the 50-day SMA, at the $607 levels.
We shall wait for a breakout and close above the resistance line of the descending channel before suggesting any long positions.
Our bullish view will be invalidated if prices break down of the range.
BCH/USD
Bitcoin Cash has been trading in a tight range for the past four days. Its history shows that it periodically enters similar tight ranges for a few days, before making a decisive move.
BCH/USD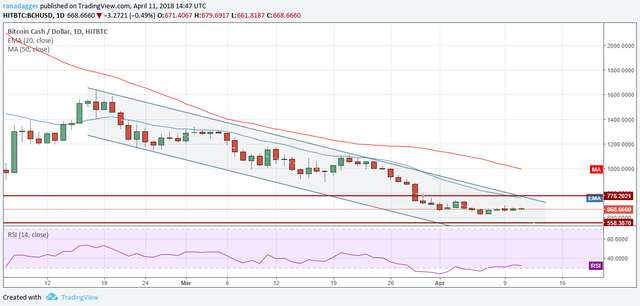
It is currently trading right at the center of the range. There is no trade set up on it until it breaks out of the $780 levels.
We shall turn bullish in the short term, once prices break out of the descending channel. Such a move can propel the BCH/USD pair towards the 50-day SMA at $994 levels.
The lower support is at $558.387. Below this, the next support is at $425.
XRP/USD
Lackluster trading activity continues in Ripple. It has been in a range since March 30, with support at $0.45351 and resistance at $0.56270.
XRP/USD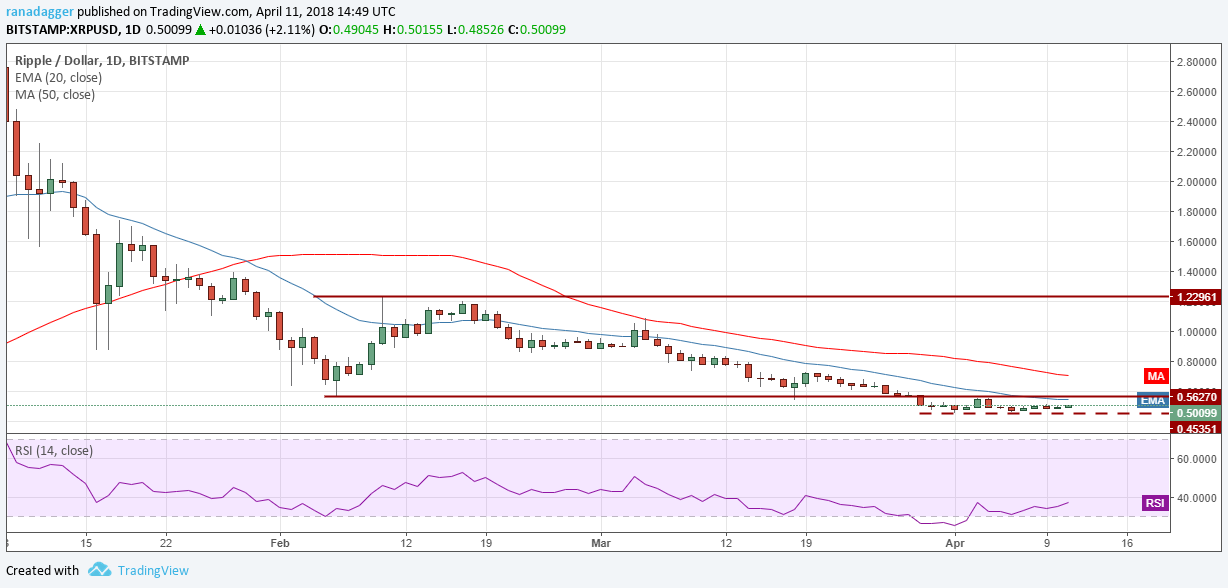
Both moving averages are sloping down, which shows continued weakness. The XRP/USD pair should gain some strength once it sustains above the $0.56270 levels. Beyond this level, it can rally to the 50-day SMA at $0.70.
We shall wait for the breakout before recommending any trades on it.
Contrary to our expectation, if the digital currency breaks down of the range, it can fall to $0.35 levels.
XLM/USD
Though Stellar is trading inside the descending channel, it has flattened out for the past few days. Usually, after such a tight consolidation, we either get a sharp breakout or a breakdown.
XLM/USD
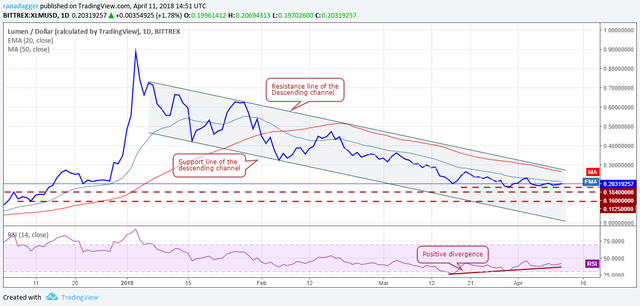
On the upside, the bulls will face a stiff resistance at the 20-day EMA, the 50-day SMA and the resistance line of the descending channel. On the downside, support exists at $0.184, $0.16 and $0.1125.
We like the positive divergence on the RSI, which favors an upside breakout. We are bullish on the XLM/USD pair but we shall wait for it to show some buying support before recommending any trade on it.
LTC/USD
We are yet to see the buyers return to Litecoin. It continues to languish near the April 01 support levels of $114.706. It has not even pulled back to the 20-day EMA, which shows weakness.
LTC/USD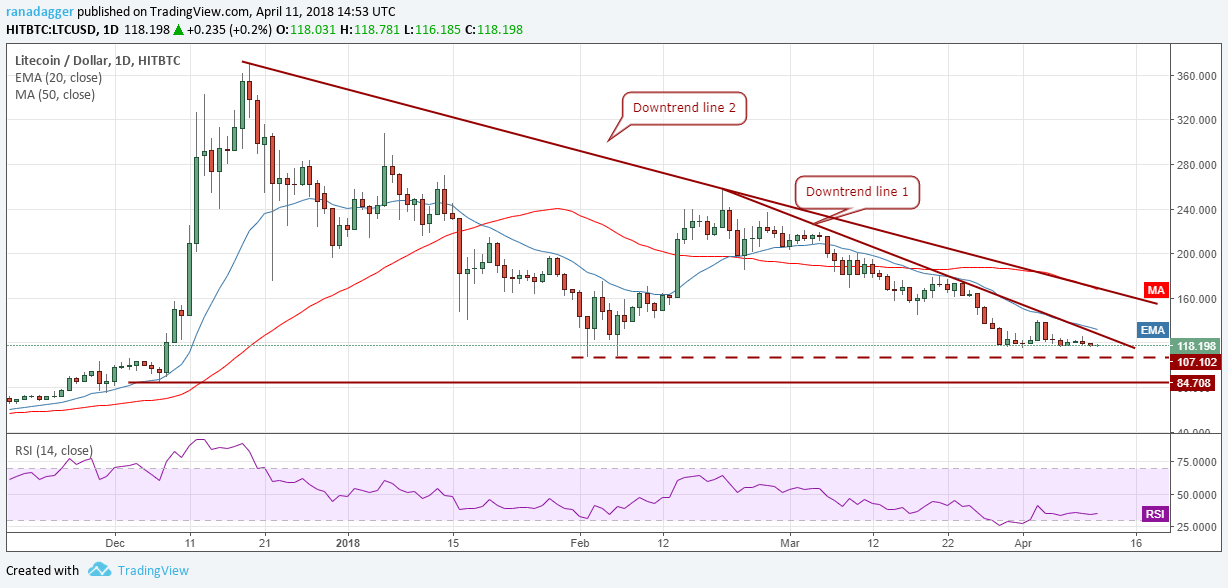
We shall wait for prices to break out of the downtrend line 1 and the 20-day EMA before proposing any trades.
On the upside, a close above the 20-day EMA will push the LTC/USD pair towards the downtrend line 2.
Conversely, if prices break below $114.706, it can slide to $107.102 and thereafter to $84.706.
ADA/BTC
Cardano is still stuck inside the ascending triangle pattern. It has a stiff resistance at the 0.00002460 mark.
ADA/BTC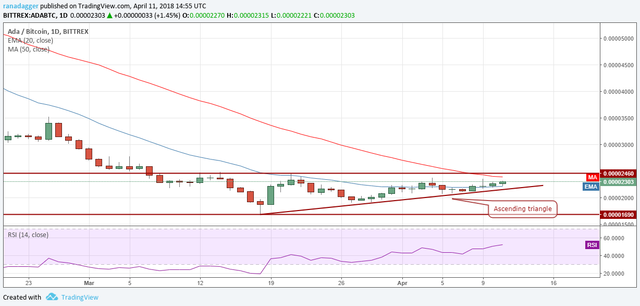
We have been waiting to buy the breakout of the overhead resistance as suggested in our previous analysis. The buy setup forms when the ADA/BTC pair breaks out and closes (UTC time frame) above 0.00002460. Our target objective from this trade is a rally to 0.0000323, which can stretch to 0.000035 levels.
Our bullish view will be invalidated if price breaks down of the 0.000021 levels.
NEO/USD
NEO is showing signs of a pullback. It had returned from the 20-day EMA on April 09 but it did not give up much ground on April 10, which shows that the buyers are stepping in at lower levels.
NEO/USD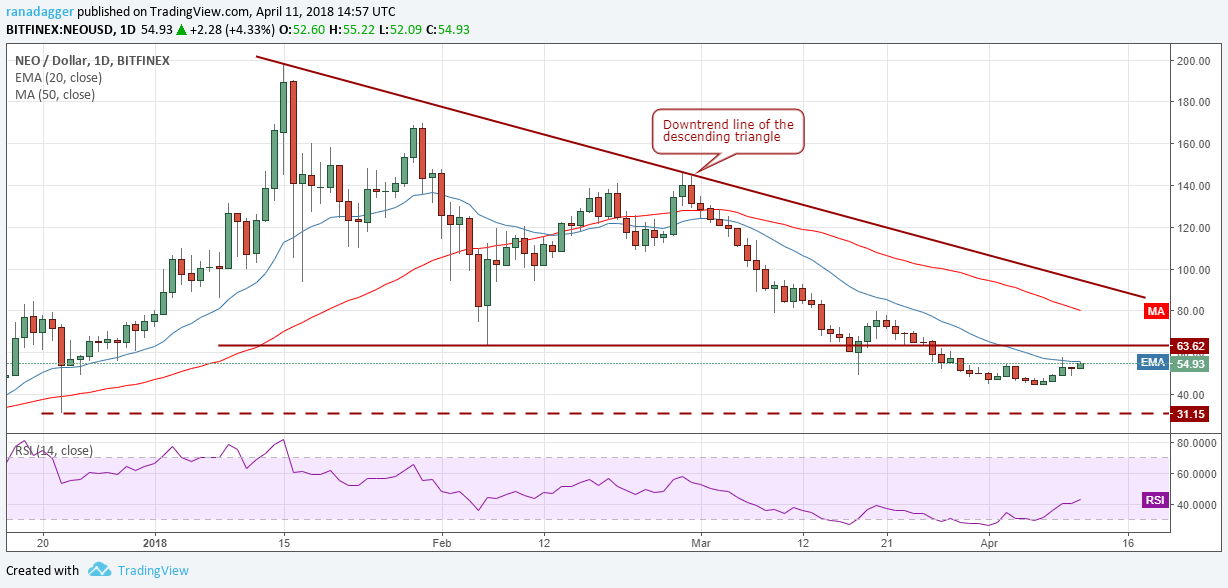
We now expect the NEO/USD pair to break out of the 20-day EMA and move towards $63.62. Once the bulls sustain prices above this level, a quick jump to $80 is possible.
Aggressive traders can enter long positions once price sustains above $64 levels for about four hours and keep a close stop loss because this is only a pullback in a downtrend. The trend will change when the coin breaks out and sustains above the downtrend line of the descending triangle.
EOS/USD
EOS had been trading inside the descending channel since February 02 of this year. Hence, a break out of this indicates a probable change in trend. The cryptocurrency can either become range bound or start a new trend.
EOS/USD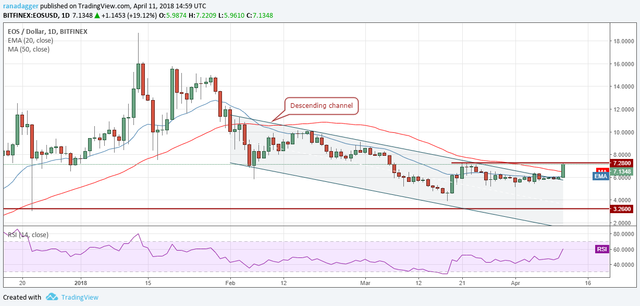
It has broken out of the 50-day SMA and is currently at the final overhead resistance at $7.28.
Once the EOS/USD pair clears this resistance, it should start a new uptrend, which has the potential to reach $11 levels. Hence, we retain our recommendation of buying the coin at $7.5 with a stop loss of $5.
If price fails to clear $7.28 levels, we may see a few days of consolidation.
The market data is provided by the HitBTC exchange. The charts for the analysis are provided by TradingVieW