Ethereum Price Outlook
Ethereum Price Outlook

Disclaimer: This article is not financial advice. The author is not a financial advisor and this article was not paid for.
For more information like this, join/follow our Telegram, Discord,Steemit, Reddit, and Twitter!
Foreword
So, the fact that Ethereum has s*** the bed is nothing new.
In just the last two days, the price of Ethereum has dropped over 33%, which is a markedly steeper drop than what the rest of the industry has faced.
Some of the Reasons for Ethereum’s Price Drop
- There’s a general sense in the cryptosphere that Ethereum will not be successful at scaling. Certain events, such as surpassing the 100M supply mark, failing to provide any viable steps toward actually scaling the protocol in an effective manner, and in-fighting/confusion within the project itself have led speculative investors to sell their Ethereum and flee in fear of the project’s imminent failure.
- Several projects have sold massive volumes of Ethereum. Here’s a Google Doc (updated; does not contain a list of all ICO wallets) where the amount of Ethereum that was sold by these projects has been tracked to a fairly significant extent. How much of an impact this has had on the price of Ethereum remains to be seen at this point. But its definitely a theory worth considering when looking at the potential number of Ethereum that has been sold this year alone.
- The fact that the community believes the theory described in #2 has also caused some amount of selling in order to hedge against the perceived risk of holding Ethereum that has been devalued by mass selling from ICOs.
- Out of the several hundred projects that have launched on the protocol, hardly any have shown any real utility or even promise. In addition, a number of tokens issued on the protocol have turned out to be outright scams, which has begun to hurt Ethereum’s overall image over time.
- Conflicting and ambiguous statements from Vitalik Buterin, the project’s leader, have also discouraged investors to a high degree. Some of his comments on the future of Ethereum and even cryptocurrency in general, have drawn sharp criticism that has resulted in overall lowered sentiment with regards to Ethereum itself.
- The price action on Ethereum has also further discouraged investment. Many have refrained from investing in Ethereum or have withdrawn their investments from Ethereum entirely due to this fact alone, which ironically, has only exacerbated the sharp decline in price.
Let’s Took a Look at Ethereum Price Action
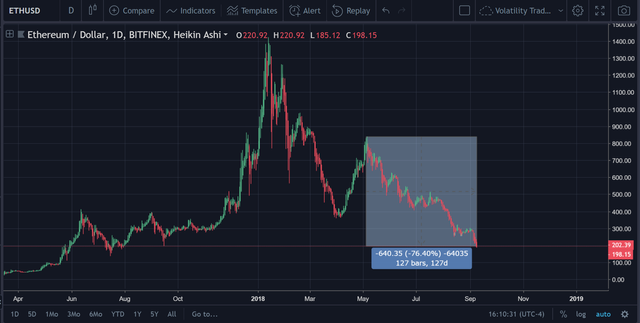
https://www.tradingview.com/x/j13Wp9Q7/
Above, we can see that the price of Ethereum has depreciated by nearly 77% since May 5th.
The date May 5th was used because that is the point when the crypto markets hit its last notable ‘high’ before the valuation of the markets sharply plummeted.
Given that fact, it is not Ethereum’s decline in price that has been alarming for investors, but rather its rate of decline in comparison to its ‘peers’ in the market.
Let’s take a look at how much some of the other top cryptocurrencies have declined over the same time period.
Bitcoin’s Price Action Since May 5th (-36.53%)

https://www.tradingview.com/x/jxhpzHQq/
Bitcoin Cash’s Price Action Since May 5th (-70.94%)
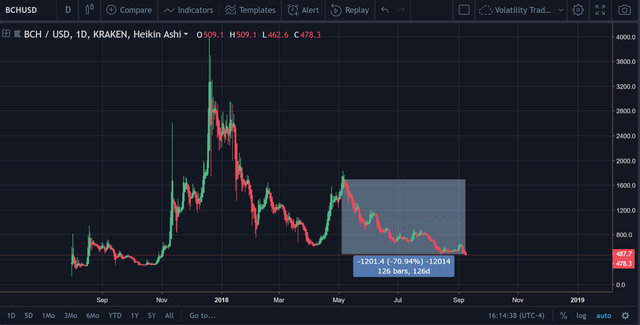
https://www.tradingview.com/x/50yMtPpm/
Ripple’s Price Action since May 5th (-69.33%)
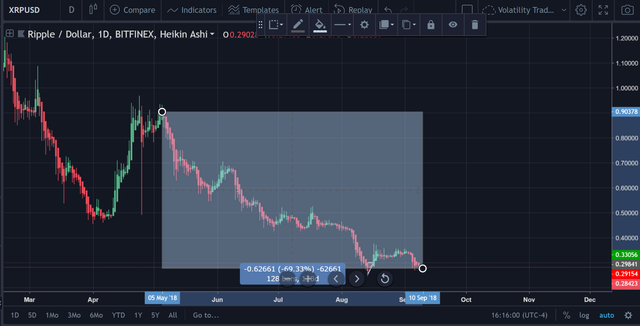
https://www.tradingview.com/x/7K8QzxNv/
Litecoin’s Price Action Since May 5th (-66.72%)
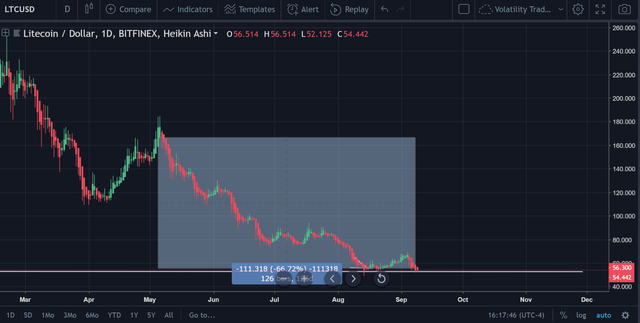
https://www.tradingview.com/x/zLxljkBA/
EOS’s Price Action Since May 5th (-72.50%)
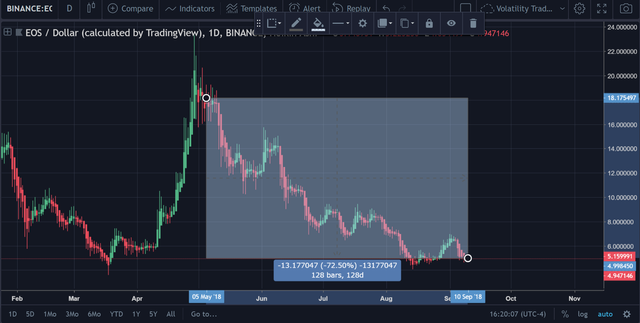
https://www.tradingview.com/x/lnC5Wd9L/
So, as we can see from the charts above, despite the fact that there are coins that have depreciated almost as much as Ethereum, Ethereum is at the head of the pack.
Recent Price Action for Ethereum
Perhaps what has been most alarming for investors has been the recent price action for Ethereum over the last week alone.
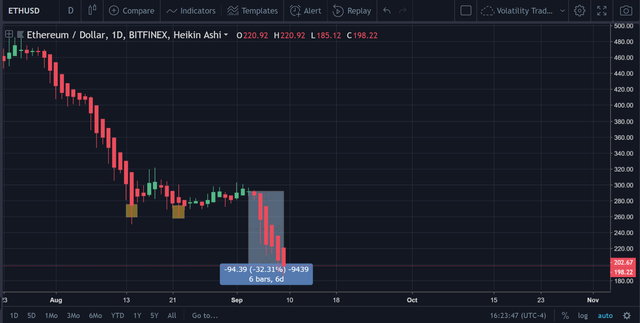
https://www.tradingview.com/x/ppMtNQqp/
Over the last 6 days, Ethereum has slid down 33% in price, which is pretty substantial, to say the least.
The host of reasons given at the top of this analysis/article are what was primarily responsible for the acceleration of this price decline in Ethereum in the last 6 days versus the rest of the market.
Now let’s take a closer look at some (if any) of the burgeoning patterns on the price chart for Ethereum.
Reverse Bump and Run (Bullish)
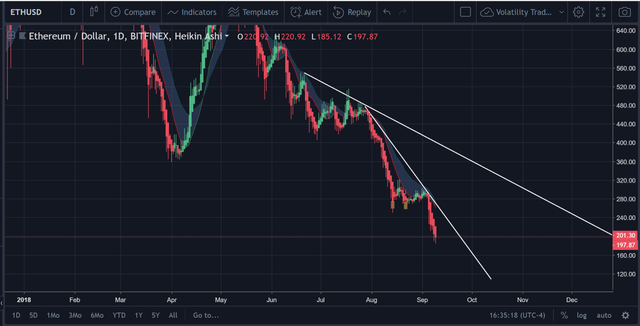
https://www.tradingview.com/x/hPe4yWzy/
Now, the word ‘bullish’ in parentheses might confuse a few traders that are looking at this chart currently, but this will be explained below.
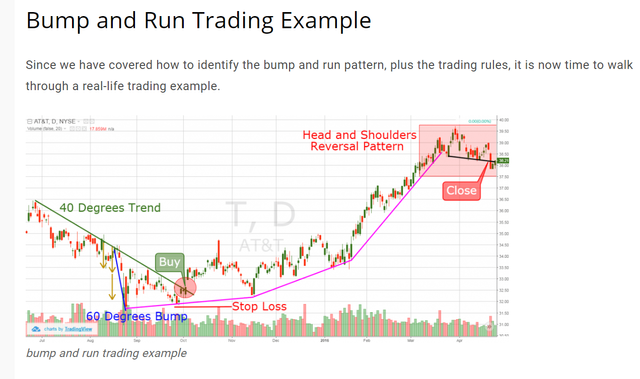
Source: https://tradingsim.com/blog/bump-and-run/#Bearish_Bump_and_Run
As you can see from the diagram/chart above, the reverse bump and run is formed when there is a steeper downtrend that is formed during an already present downtrend.
This is clearly present on the price chart of Ethereum.
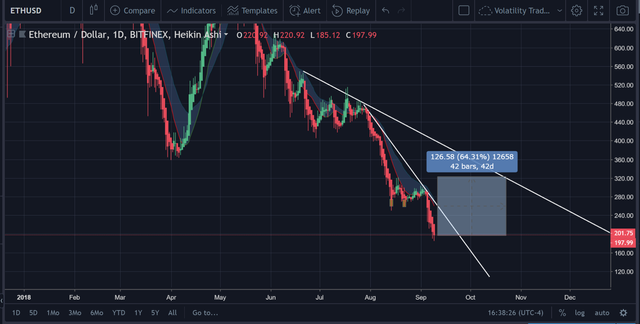
However, as the chart above dictates, the safest buy signal would be generated when the price exceeds the original downtrend line.
For Ethereum, that would be at $322 (give or take a few dollars).
https://www.tradingview.com/x/oQ8zxfp1/
As can be seen on the chart above, this would represent a +64.31% increase from where the price is currently.
Thus, the price is quite a ways away from reaching this point.
However, if the most recent downtrend is broken, that would probably represent a fairly substantial increase in price.
Despite the notable backslide in price for Ethereum, there are still technicals that could represent short-term buy opportunities in the near future.
Ethereum EMA Mean Reversion (H4)
https://www.tradingview.com/x/dPtDx4yf/
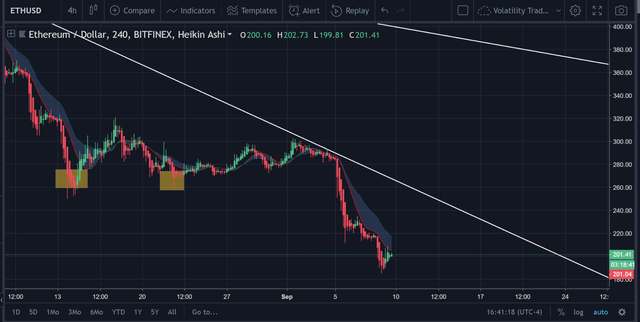
In a nutshell, the EMA mean reversion (that blue cloud thing in the picture above), is:
- ‘Above’ the price. Think of this as blue area = cloud in Ichimoku.
- The bottom line is ‘red’, which also signals sell.
- The size of the cloud has not ‘narrowed’, which would signal an impending trend reversal.
So, our EMA mean reversion is not showing us anything that would indicate a trend reversal despite the fact that we’re seeing some green candles at the end of that transmission there.
RSI Signals

https://www.tradingview.com/x/jyIhjIzK/
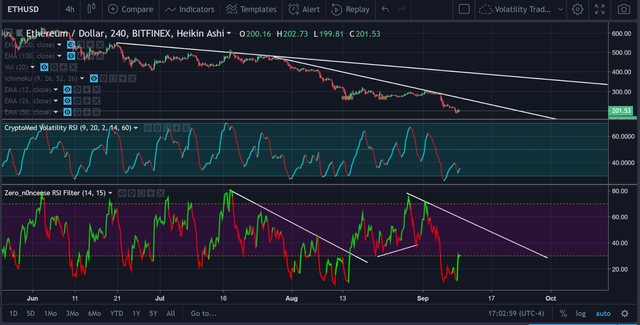
Zero_n0ncense Volatility RSI
This is a custom creator created by the author that tracks the volatility. There are also buy/sell signals that are produced here as well.
Blue = buy
Red = sell
Above, we can see that there is a ‘buy’ signal that has just emerged. However, this gives no guarantees as to how long this will last.
Zero_n0ncense RSI Filter
This is a normal RSI with buy+sell signals created on it. The recent price action has resulted in a sharp spike, but onlookers should not be fooled.
Whenever there is a sharp decrease in the price of a security/stock/crypto/whatever, even a modest increase in price will result in a ‘spike’ because of the mathematical formula that underpins the RSI calculation itself.

Source: https://www.iexplain.org/rsi-how-to-calculate-it/
If you get some scratch paper and start working out this formula on paper, you’ll see how even a slight change in price can lead to a spike in RSI.
That is why it is important to look at changes in RSI over a longer period of time like you see below, for example:
https://www.tradingview.com/x/eZRgarea/
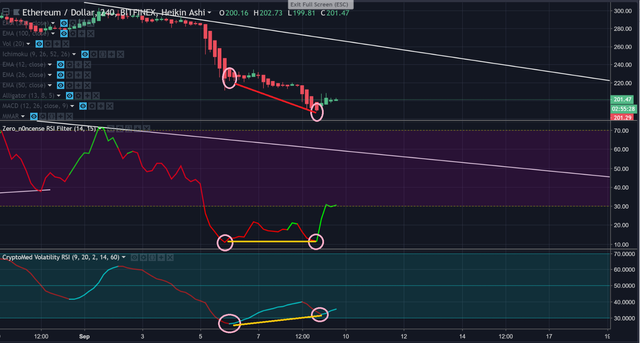
In the above picture, we identify a considerable amount of divergence in the Volatility RSI. The RSI remains flat for the RSI filter (second panel).
What is depicted above is commonly known as ‘positive divergence’. This essentially refers to the phenomenon of the decrease in the literal price of an asset, while the RSI has increased over that same period.
In order to track this, you must look at lows and highs, one cannot simply look at one period to another.
Clarification of the RSI Signals
Essentially, what these signals are showing is that there will may be a reversal in the price at some point in time.
However, this is something that may not take place for a decent amount of time.
Even on the H4, the price is currently below the EMA-12 and appears to be mired in its attempts to rise above.
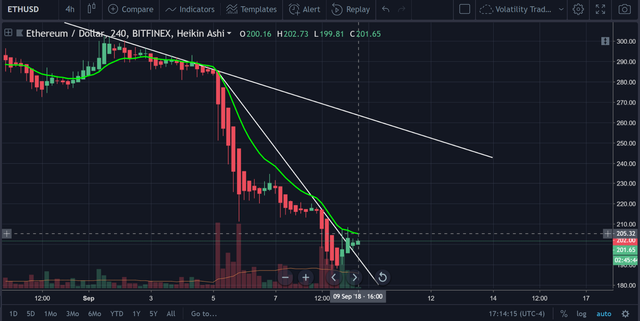
https://www.tradingview.com/x/L8BOsYfz/
In addition, for the volume reading that you can see in the picture above, it has declined substantially over the last few periods (H4), which is an indication of seriously waning buy support.
Therefore, a long position (in the short-term), more than likely would not be advisable until the EMA-12 (at least) has been broken with some level of strength with a candle (Heikin Ashi is what this chart uses) closing entirely above that EMA-12 indicator.
Overall Conclusion
While this is not a full price analysis since it does not take a comprehensive look at Ethereum’s price action in the distant future, this should serve as a comprehensive guide to help traders and others understand what has caused Ethereum’s recent abysmal price action as well as the likelihood of the price going up at any point in the near future.
In the author’s opinion, there should be a bounce in the price at some point in the future, but factors such as ‘how much’ of a bounce and ‘when’ are entirely unknown at this point.
Thus, investors should tread with caution. For those that are continuing to short Ethereum, a S/L of $220 is probably best.
Not Looking very good for ETH
Posted using Partiko iOS
Congratulations @proofofresearch! You have completed the following achievement on the Steem blockchain and have been rewarded with new badge(s) :
Click on the badge to view your Board of Honor.
If you no longer want to receive notifications, reply to this comment with the word
STOPDo not miss the last post from @steemitboard:
Coins mentioned in post: