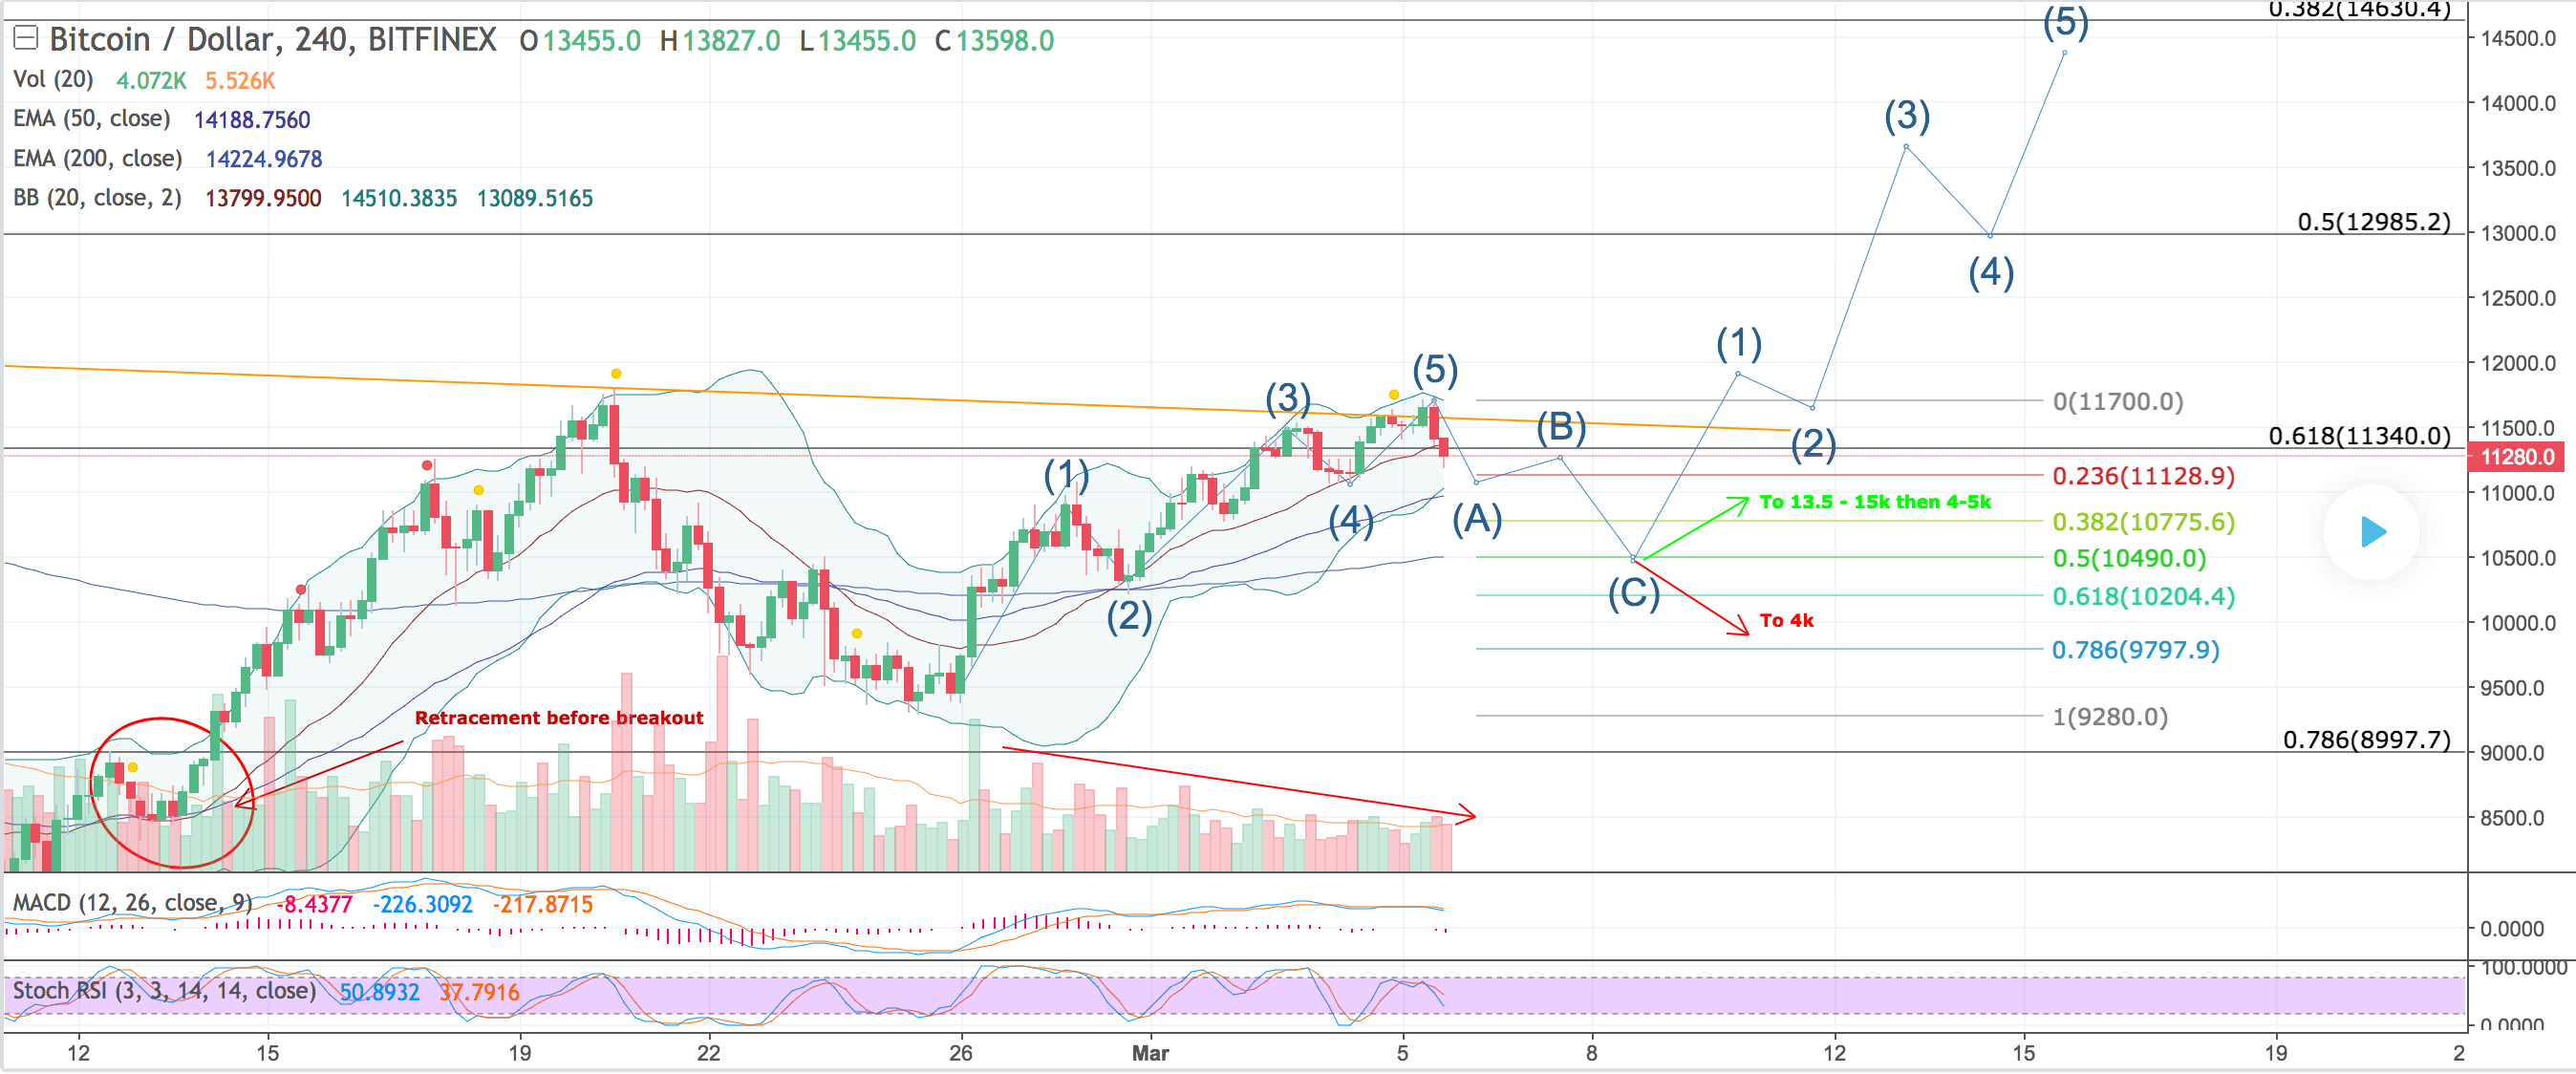
BTCUSD Failed breakout and ABC correction

BTC had a failed breakout and now the 4-hr candle is very likely to close below the Boll mid-track, which will confirm that this is a larger retracement rather than a small corrective wave. BTC now is heading south to 11100 (0.236 retracement level). It will find support around 11000. It may fall between 0.236 fib and EMA 50 and then bounce a little bit before the C wave.
The C wave may stop between 10500 (0.5 fib) and EMA 200. Then BTC will make a choice. It could go up and challenge the neckline again, just like it did on Feb 13. If it breaks out and goes above 12000, we will see a exponential price growth right after that because many bears who are staying out right now will be convinced that the market has reversed. The whales will dump their bag between 13.5k and 15k . Then they will likely make another crash to 4-5k.
However, if BTC decides to keep going lower after 10500 (which seems it will), then we will officially enter a long-term bearish market. BTC will go sideway and bleed to 4k or even to 2k in the following months. You can check the BTC chart in 2014 to know what will happen if this is the case.
At last, personally I think the first scenario has a higher chance to happen, considering whales tried hard to pump the price up in the past week while volume goes lower. It seems that they want to paint the iH&S pattern and they want to convince more people to come back to the market.
Good luck everyone! And remember you can short on many platforms instead of steeping out.