BITCOIN TECHNICAL ANALYSIS

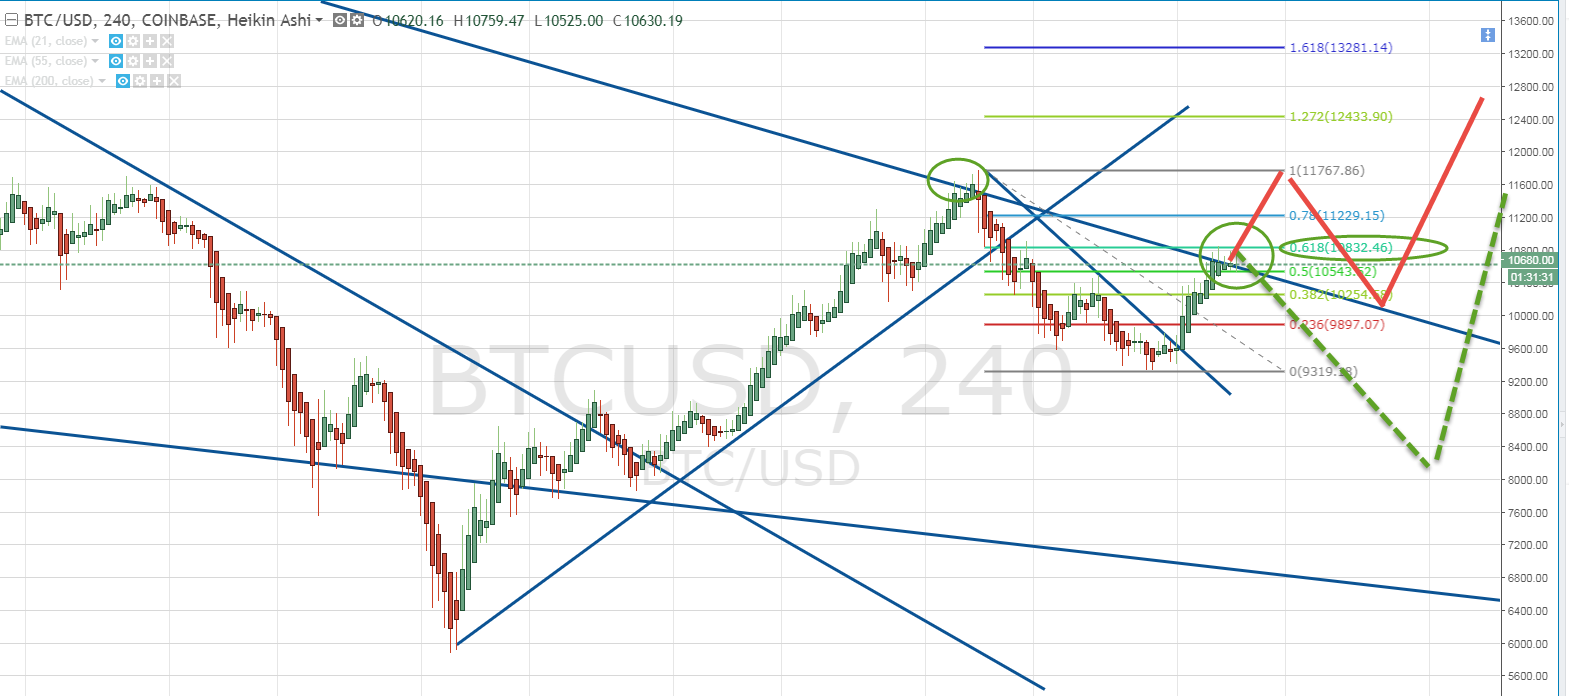
Bitcoin is back to the down moving trendline and testing it as a resistance and now its a double resistance because its also a 61% fib retracement of the down move.
I have put 2 scenario in Red and Green.
For now I think it might follow green scenario where it will move down to near 8200 level and then move up. 8200 is a 61% fib ratio of the up move. I am looking to pick up some btc at 8200.
If it moves up from the current level then I will be strong bullish and will be looking to get in when it comes back down to test the broken trendline resistance as a support.
If you like it please upvote it and resteem it and comments are welcome.
NOTE: I am not a financial adviser and this is for education and entertainment purpose only. This is not a trading advise and just my opinion, please trade at your risk and do your research.
I agree with your analysis, hopefully BTC bounces off the upper trendline and breaks 12k soon! Did a similar analysis a yesterday for Bitcoin as well.
Great!!