Bitcoin/Etherium technical analysis. Bullish breakout!!!
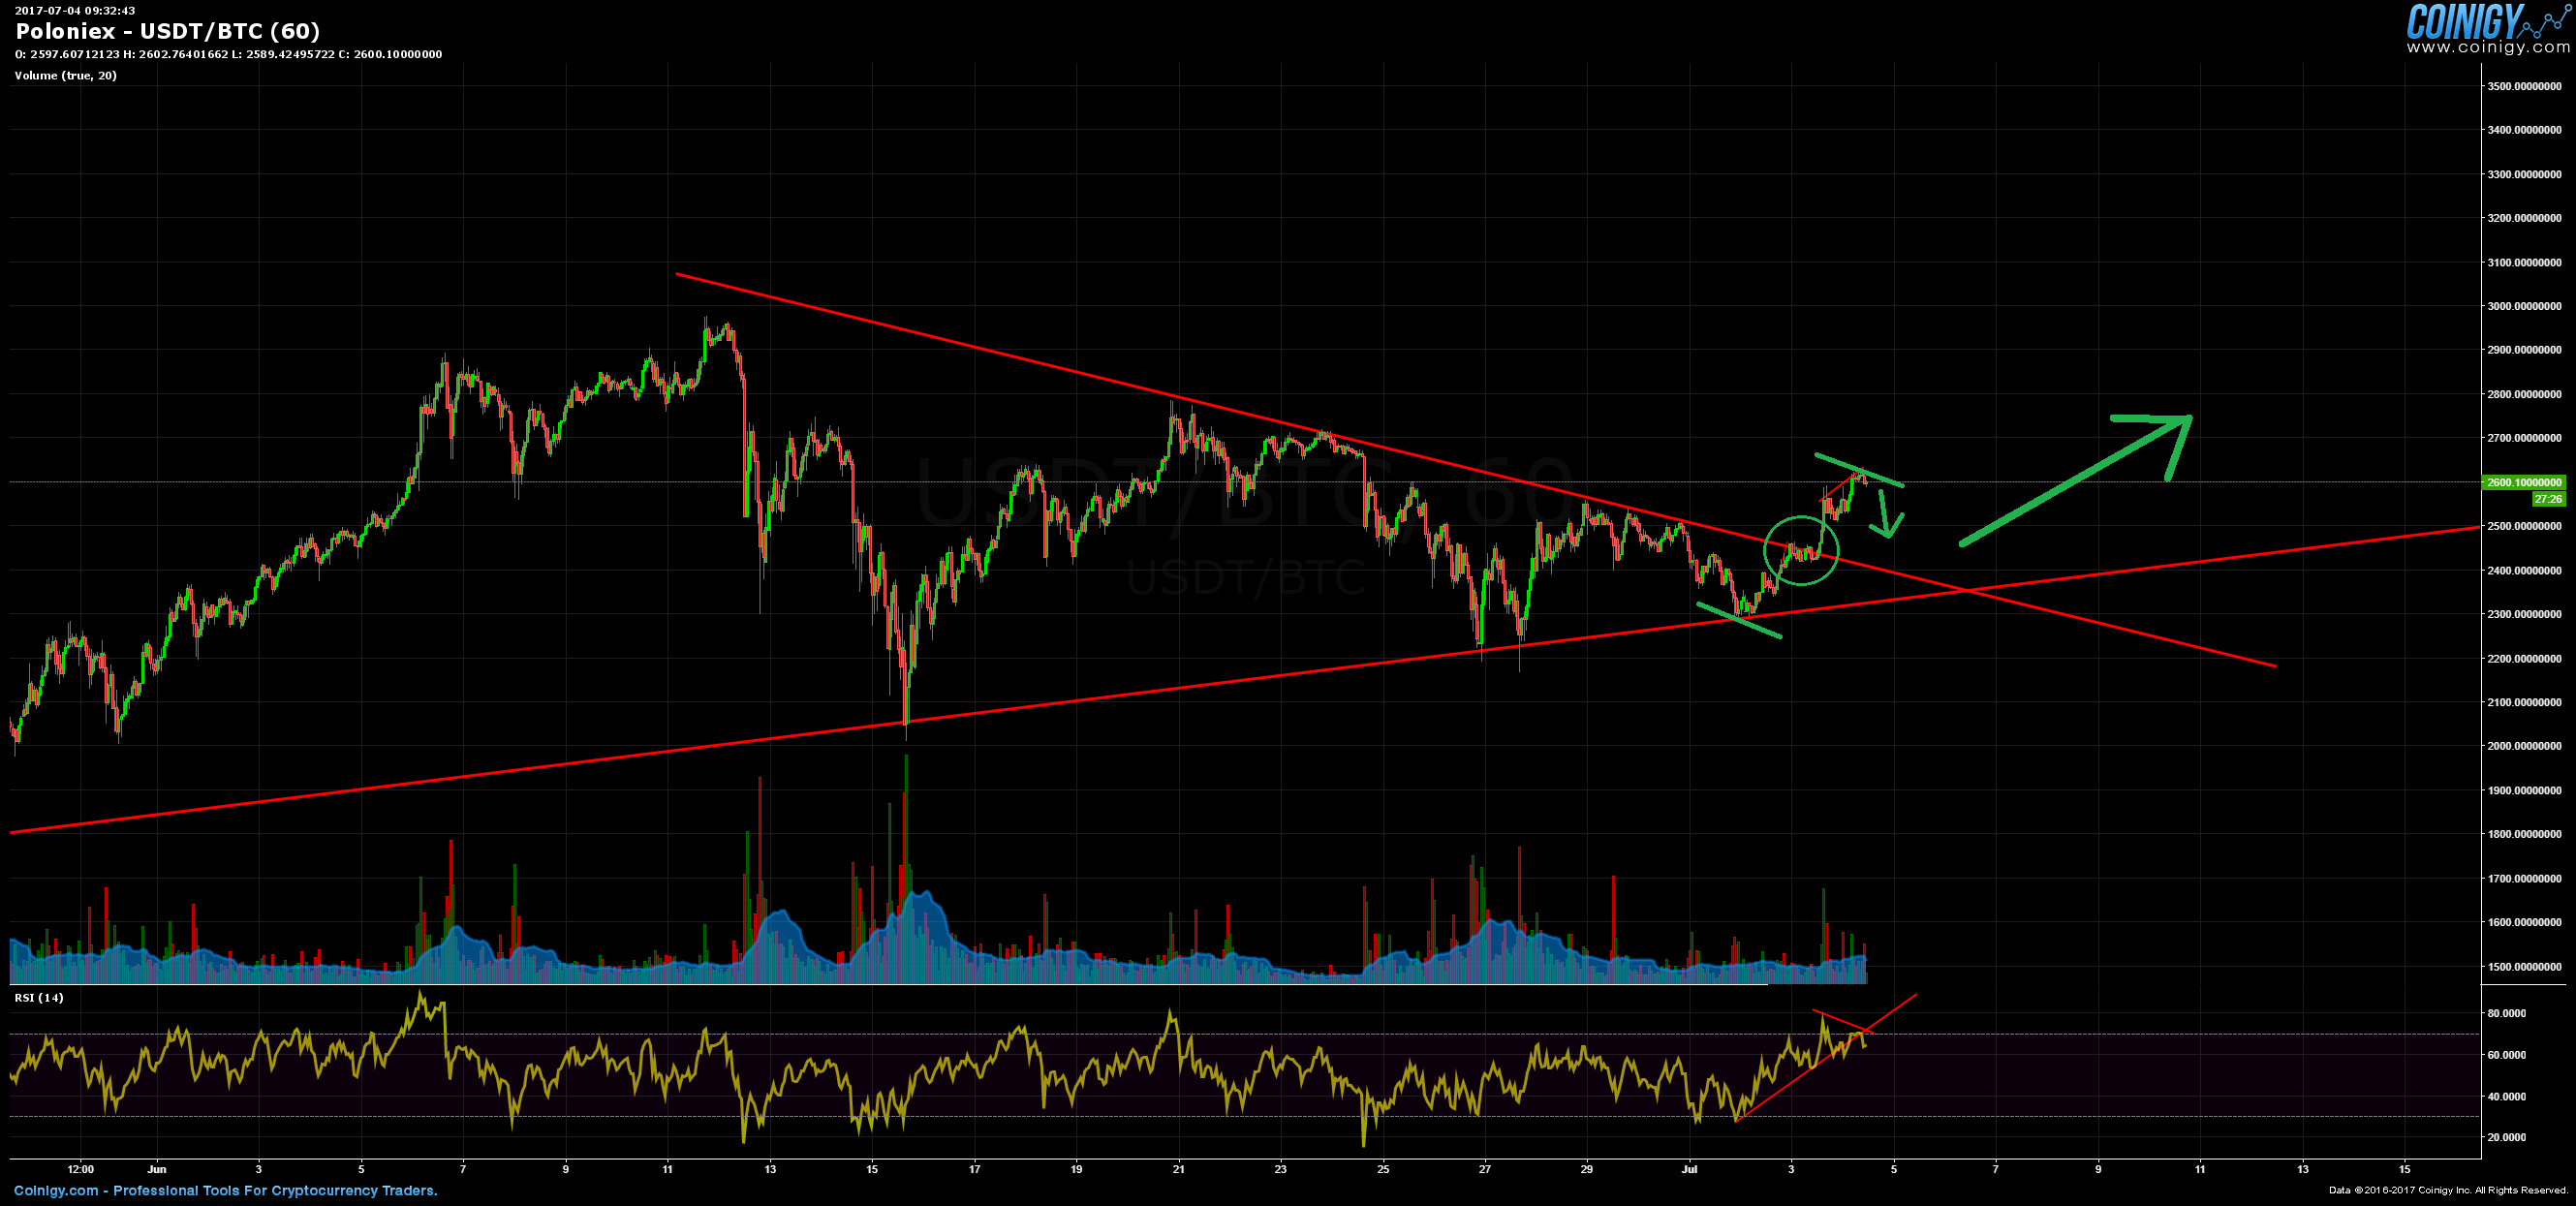
The last days were very critical. We did not know if the breakout of the huge triangle will be a bullish breakout or bearish breakout.
We got now a upward breakout of the triangle. If we consider the huge size of the triangle, we can assume that the bullish rally will bring us to the 3000 $ and even further..... !!!
The break of the resistanceline now happened and the strong resistance line now turned to a strong support line!
So now the price will probably test the line (we also see a small bearish divergence on the RSI and a RSI trendline break)
After a small correction (maybe down to the trendline at ~2400$) the price will continue its uptrend.

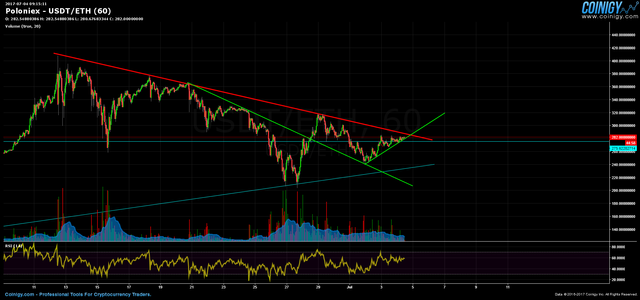
On the next chart we see the Etherium/Usdt chart. Now that Bitcoin broke the trend bullish. I assume that also etherium will get a bullish move now and break the resistance.

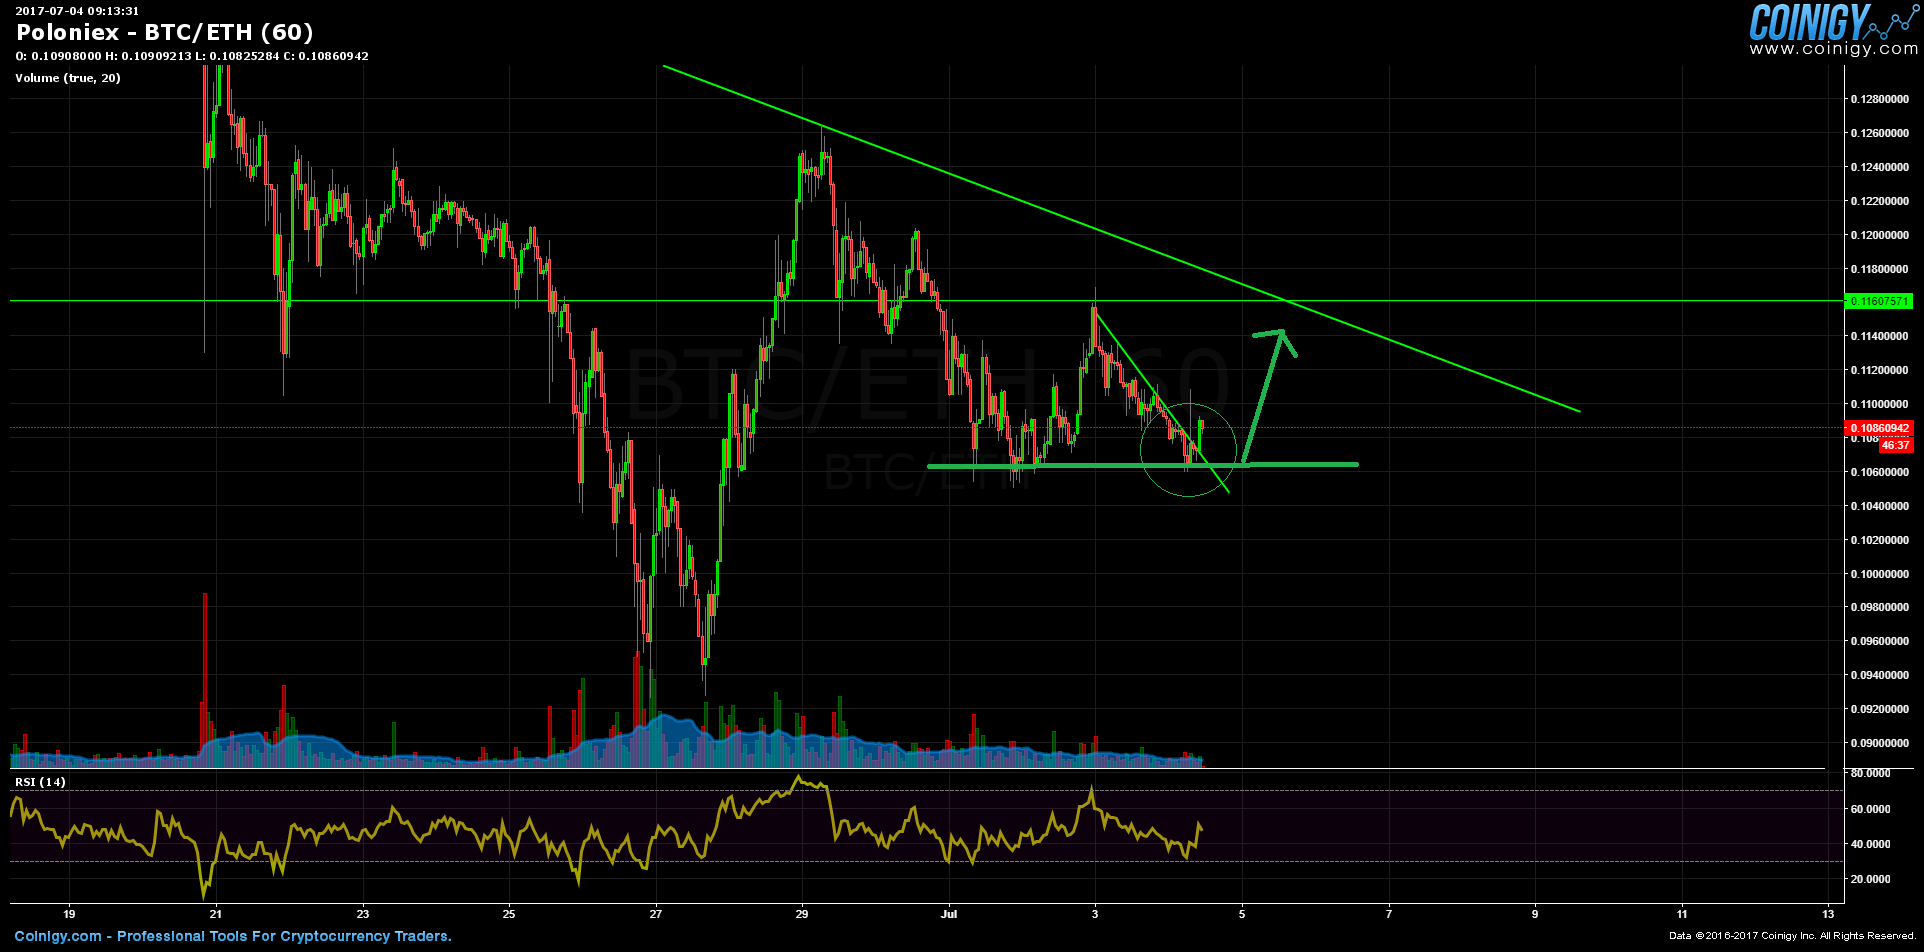
On the next chart. The Etherium/Btc chart. We also see that Etherium vs bitcoin seems like it break the resistance line and go up versus the bitcoin. At least up to the next resistance line.

So in conclusion we can assume that the the cryptocurrency sector is on a bullish move.
In short term(hours/days) Etherium will rise more than bitcoin.
But in general everything seems bullish.
We are Looking at some BIG Upside Again in the near term
yes im glad that we broke the triangle bullish. The formation was so huge... and all 3 major crashes were involved in it..... the bullish rally will bring us to 3000. and probably further up