Bitcoin technical analysis for this week. BTC Teknik analiz.
This is my first post on steemit. So ı want to say hello to all community before ı explain my bitcoin technical analysis fo this week.
Generally ı don't use indicators. I make my analysis with patterns, elliot wave principle and pivot, support&resistance. But if use some, I always choose Ichımoku and bollinger bands
So in this weekly analysis ı use both patterns and those indicators. So here we go.

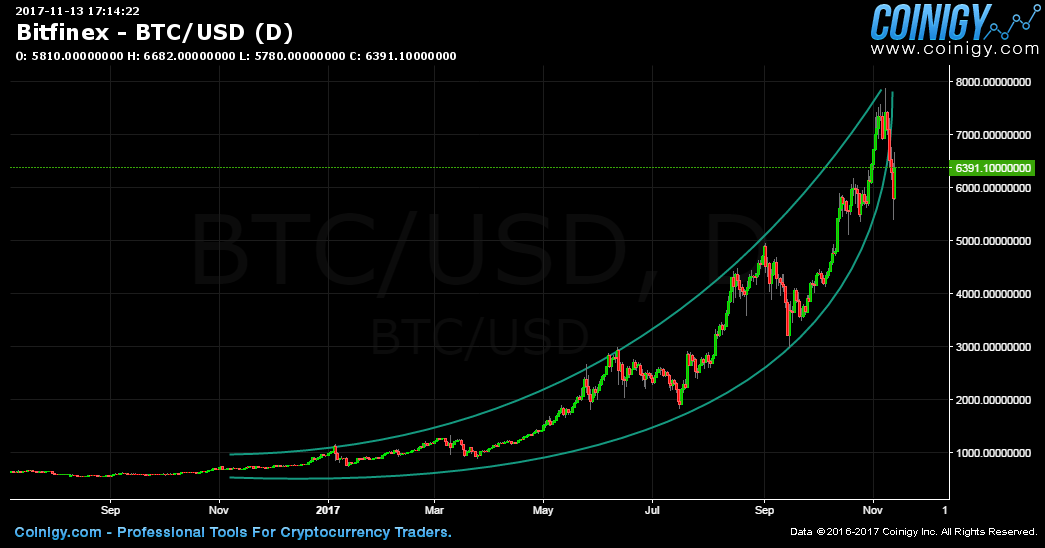
First of all ı want to show you the parabolic pattern of Bitcoin. Parabolic patterns are rare but trustworthy and are generated in strong bull trends. But parabolic is really reversal pattern. Most parabolic patterns have an important correction of %61.8- %78.6 from the top.
What can we expect to see if this pattern ends?
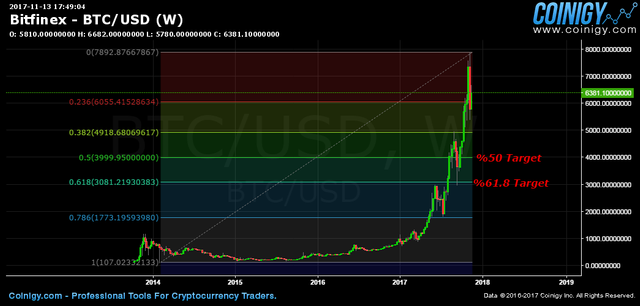
We can expect to see important correction. So ı will show you how.

Now lets check our ıchımoku and bollinger ındıcators.
Ichımoku and bollinger bands looks complicated on chart. But ıf you understand the basics it is really easy to use.

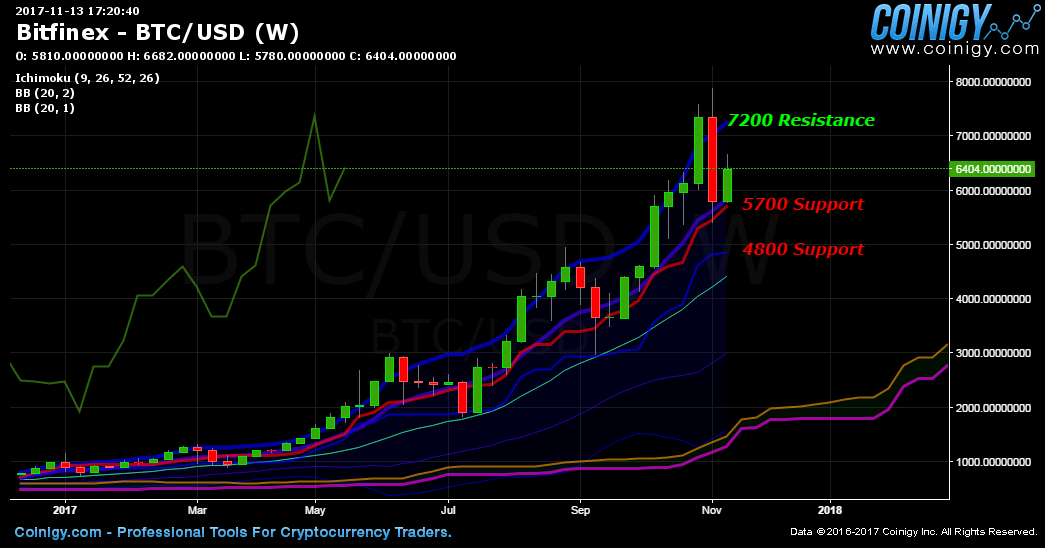
After 8 weeks bullish periods last week we saw reversal with bearish engulfing candlestick. The price dropped to first support tenkan-sen(red line). this drop show us bulls are lose some power after strong 8 weeks. So what we do with this information?
We will be careful in this week about our position. This week will be like a crash between bulls and bears. There is resistance up bollinger band, there are supports Tenkan-sen, Kijun-sen(blue band).
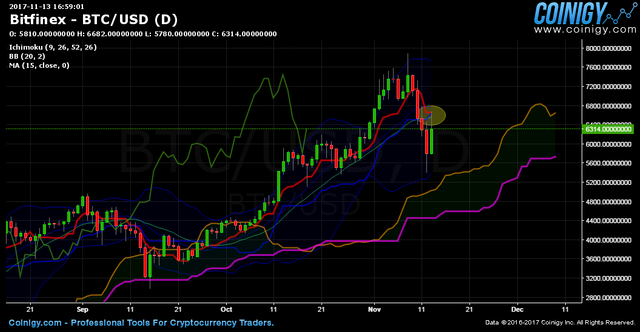
İn daily chart there are really strong resistances around 6600$. Tenkan-sen, kijun sen and middle bolinger band almost together on 6600$. so my opinion for this week to consider the high volatility of BTC ı can not see any trend for this week. İn daily chart there is supports around 5200. They are lower bollinger band and ıchımoku clouds.

I want to share with you pivot,support and resistance for this week.
Pivot:6370$ Support:4850 Resistance:7350
And a bonus. How parabolic pattern was finished on gold

I hope my analysis will help you for this week. İt is not investmen advice. Good luck for every one.
Source for charts: www.coinigy.com
wwww.tradingview.com
Türkçe: Arkadaşlar öncelikle herkese merhaba bu benim topluluktaki ilk gönderim. Bu haftaki bitcoin teknik analizimi sizlerle paylaşmak istedim.
Genelde analiz yaparken indikatörleri fazla kulllanmam. Çünkü grafiğin üstüne indikatörleri doldurunca bazen fiyatı göremez hale gelebiliyoruz. Analiz yaparken paternleri, elliot dalga prensibini ve pivot destek direnç noktalarını kullanırım. Bu analizde ıchımoku, bollinger bantları ve pivot destek direnç seviyelerinden yararlandım.
İlk grafikte gördüğünüz gibi bitcoin uzun zamandır parabolic paternde yükselişine devam ediyordu. Parabolic paternler genelde aniden yüksek hacimle dönüş gösterirler. Dönüncede genelde yükselişin %61.8 ve %78.6 sını geri verirler. Tabi bu geri veriş yeni bir yükseliş zeminini hazırlar.
2.Grafikte bu muhtemel dönüşte olabilecek hedefleri göstermek istedim.
3.Grafikte ise haftalık destek ve direnç seviyeleri var.
4.Grafikte ise günlük grafikte 6600$ civarında Tenkan-sen(kırmızı çizgi), Kijun-sen(mavi çizgi, orta bollinger bantı(Yeşil ince çizgi). Tarafından oluşturulan güçlü dirençeleri göstermek istedim.
En son grafikte ise daha önceden parabolic patern yapmış altın grafiğini göstermek istedim. Dikkat ederseniz taralı alan bitcoinin 2014-2014 grafiğine çok benzemektedir.
8 haftadır devam eden güçlü yükseliş trendinden sonra geçen hafta sert bir düşüş geldi ve yutan ayı mum çubuğu formasyonuyla da bunu destekledi. Boğalar geçen hafta güç kaybetti ama tamamını değil. Ayılar biraz güç kazandı ama yeterli değil. Bu hafta boyunca boğalar ve ayılar arasında şiddetle çarpışmalar geçeceğini düşünüyorum ve fiyatların yeni bir en yükseğe ya da yeni bir en düşüğe ulaşamadan haftanın kapanacağını düşünüyorum. Daha çok yeni bir trend yapmaktan ziyade bu hafta dağılımda olacaktır.
Tabiki de bunlar yatırım tavsiyesi değildir bilgi amaçlı paylaşımdır. Herkese şimdiden çok teşekkür ederim.
How do you think the bch fork will effect btc price?
ıt can not effect BTC. BTC is already in correction. I believe socionomic theory. Bitcoin is falling because ıt must complete the cycle. It needs correction the borders of fibonacci levels.
@turbot !welcome
Merhaba nomercy,
Steem dünyasına hoşgeldiniz. Yeni bir kullanıcı olarak bilmeniz gereken
birkaç konuyu sizin için derledik.
Kullanım
İçerik üretirken dikkat edilmesi gerekenler
Botlar
Botlarda kullanmanız üzere size 0.002 SBD yolladım. Bazı botları kullanıp yazılarınıza oy almak için bu yazıyı okuyabilirsiniz.
Ayrıca, Steemit Türkiye discord sunucusu üzerinden bize anlık olarak ulaşabilir, tr topluluğuna aktif olarak destek verebilir, merak ettiklerinizi sorabilirsiniz.
@nomercy hoş geldin grafiklerini mümkün mertebe bekleriz
Hoşbulduk, teşekkür ederim. Fırsat buldukça paylaşmaya çalışacağım
Congratulations @nomercy! You have completed some achievement on Steemit and have been rewarded with new badge(s) :
Click on any badge to view your own Board of Honor on SteemitBoard.
For more information about SteemitBoard, click here
If you no longer want to receive notifications, reply to this comment with the word
STOPCongratulations @nomercy! You have completed some achievement on Steemit and have been rewarded with new badge(s) :
Click on any badge to view your own Board of Honor on SteemitBoard.
For more information about SteemitBoard, click here
If you no longer want to receive notifications, reply to this comment with the word
STOP