Bitcoin Price Action 24/11/2017
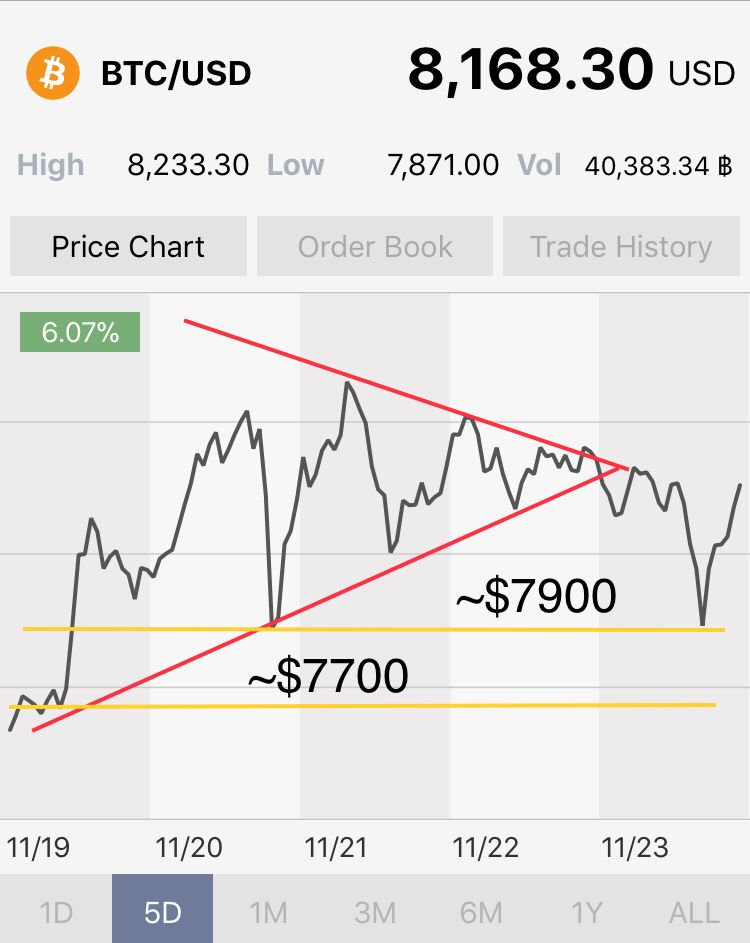
Since my last post about a short term symmetric triangle formation in the bitcoin price, the price has already broken out of the symmetric triangle pattern.

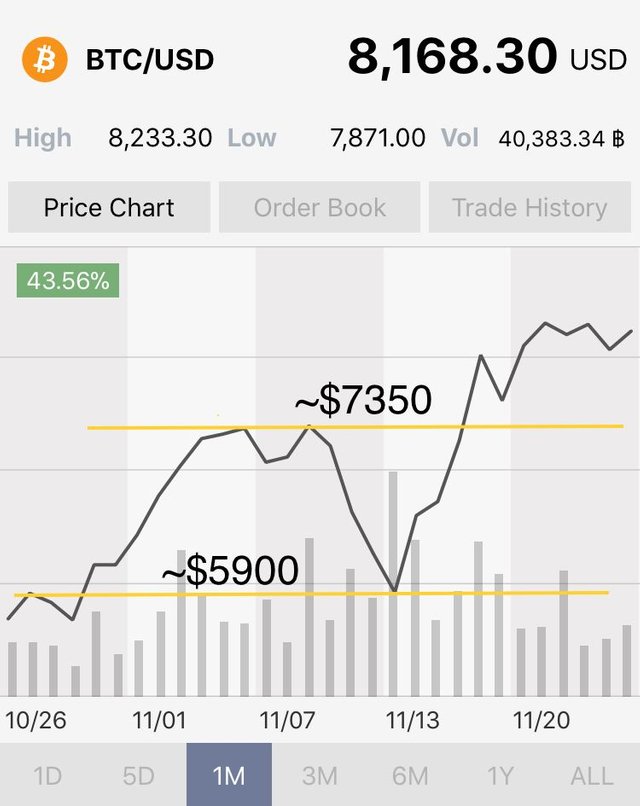
The price quickly found support around the $7900 level, bouncing off the previous support. Lower support is also in place at $7700, $7350, and $5900

It will be interesting to see where it goes from here. There are several possibilities:
- Bitcoin Price recovers from the recent drop, and breaks above to further highs
- Continue on in a neutral trading range between $7900 to $8350
- Test support below at $7350 or even lower $5900
- Begin to form a descending triangle formation with a base at $7900, in which case, look out below as they are a bearish signal
It’s a bit of a wait and see approach until further confirmation in the price action.