BITCOIN Chart - Some TA
Following on from y last post:
https://steemit.com/bitcoin/@mu5hu/bitcoin-charts
I noted at the end it had a little bit to go to touch the 100D MA.
Over the next 2 days it did hit that 100D MA quite strongly but it also bounced back quite well
1D
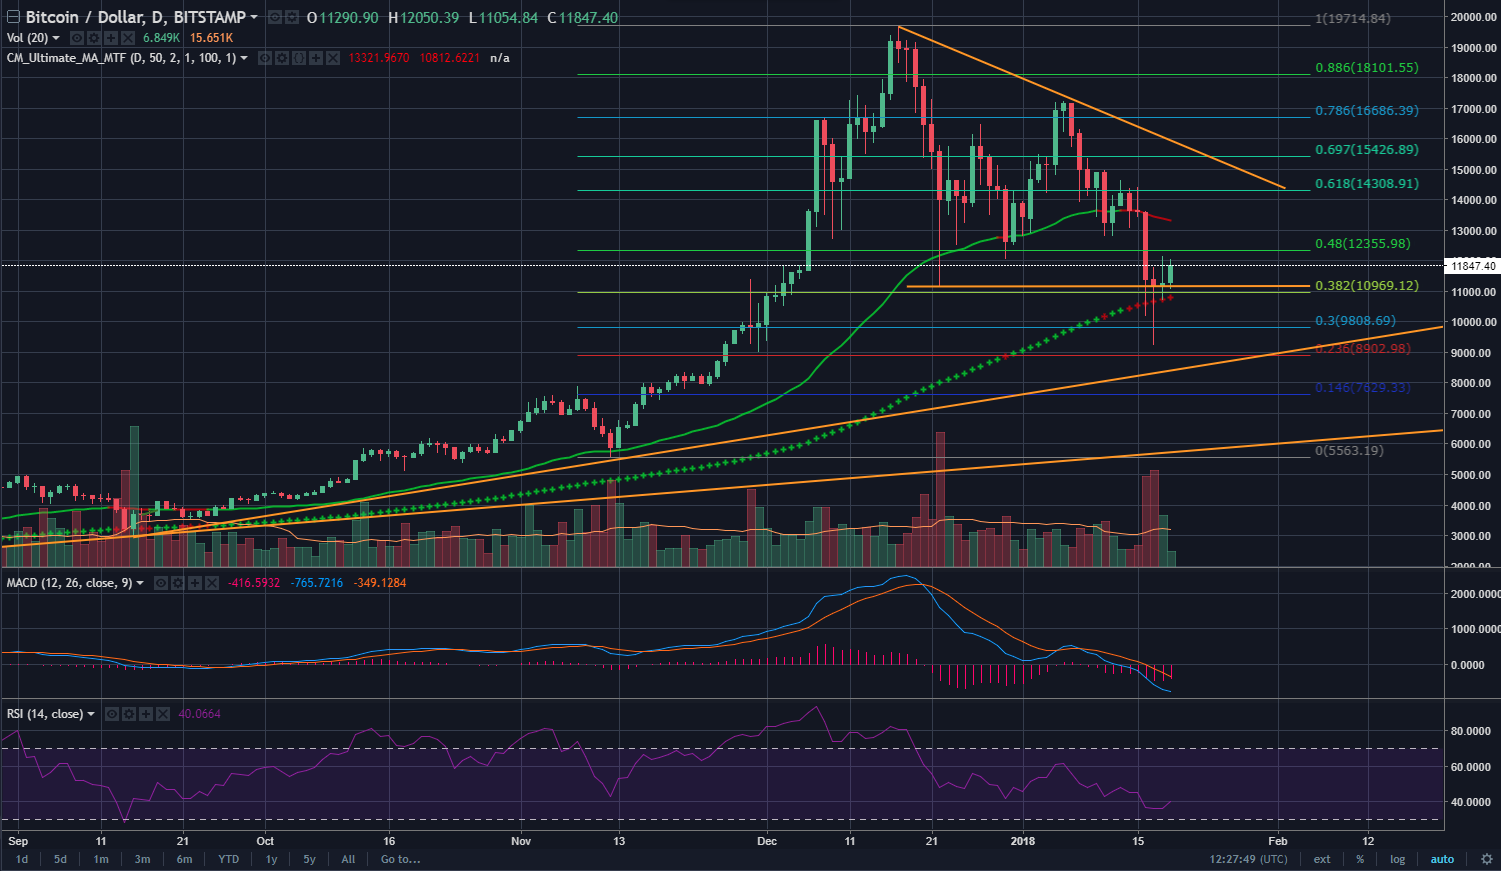
In my opinion, we are in the bottom area of this correction.
We could see some side ways movement in a channel as people take some profits, people start putting more money in after calming down from that 50%+ drop.
The RSI hasn't come all the way down and touched the Oversold line yet, which is why i think there could be a double bottom on the price. There might be another drop but i don't think it will be anything further than the previous low a couple of days ago.
4H
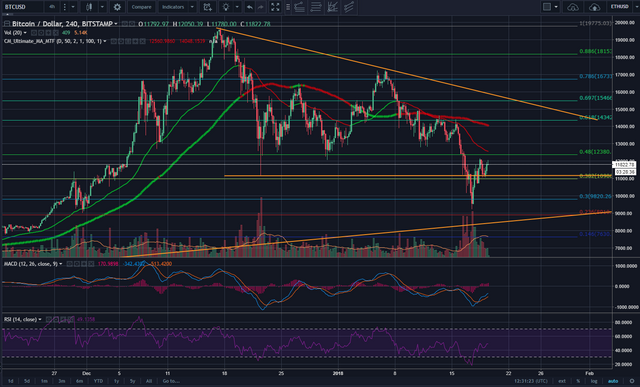
On the 4H charts, it shows the bounce off the same level as it did at the end of Nov. The RSI did go into Oversold, which saw people buy back in and push the price back up. I think this was opportunity for traders to get in, and we will see some of them start to take profits.
1H
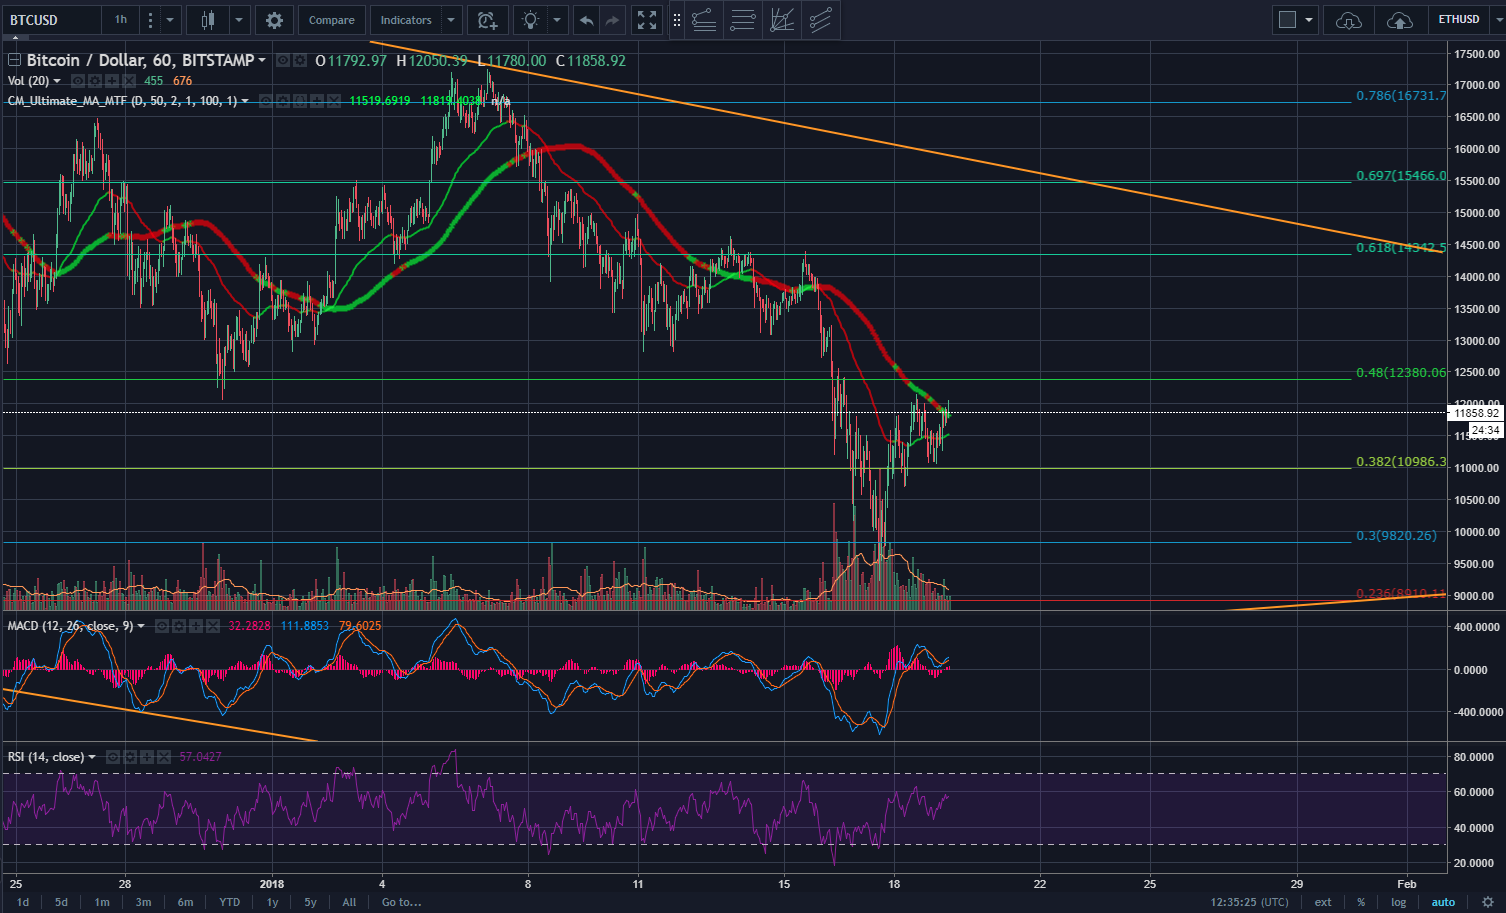
In the 1H charts, The RSI diverged from the price, with the price going lower, but the RSI going higher, which is an indicator of a price reversal.
At the 1HR time frame, this is a short run upwards, but as i stated before, profit taking will probably start to happen over the next couple of days.
What will we see over the next week?
It is possible we will see an RSI divergence on the 1D, which means that the price might actually drop down to maybe its low of $9500 or lower, but the RSI doesn't drop as low as it's previous low.
Or the other option is that the price makes a higher low and channels sideways.
I personally think the price needs to move sideways for a little while and consolidate and let the moving averages to catch up before its next leg up.
Good Luck
Hodl strong.