BITCOIN Chart
Most cryptos had a bit of a red day today.
Lets have a look at Bitcoin's Chart to see what it could do.
1D
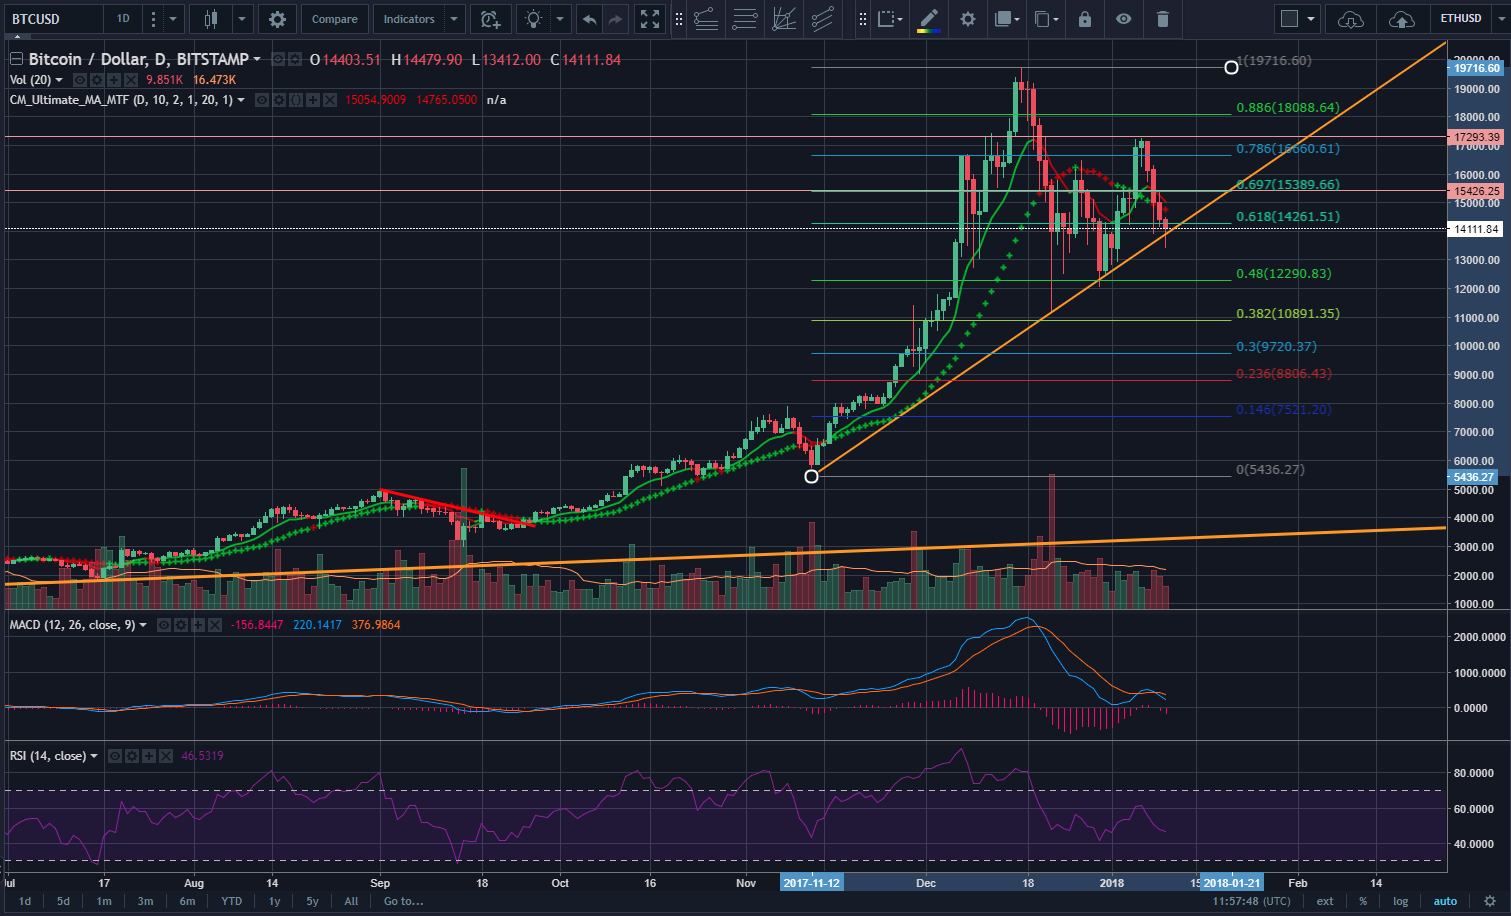
Bitcoin is back on the trend line which is has respected in the past. It has tested it a few times now and the low keep getting higher.
Volume on this sell off has been decreasing.
RSI isn't over sold yet.
4Hr

On the 4Hr charts, the latest candle has a long wick which tested the trend line.
The volume was quite high so buying power is quite strong which says everyone else is looking at the same trend line.
The RSI is touching the Oversold line so this could indicate its going to bounce back up and follow the trend line.
The MACD and Moving average is still heading south so something to be cautious of.
2Hr
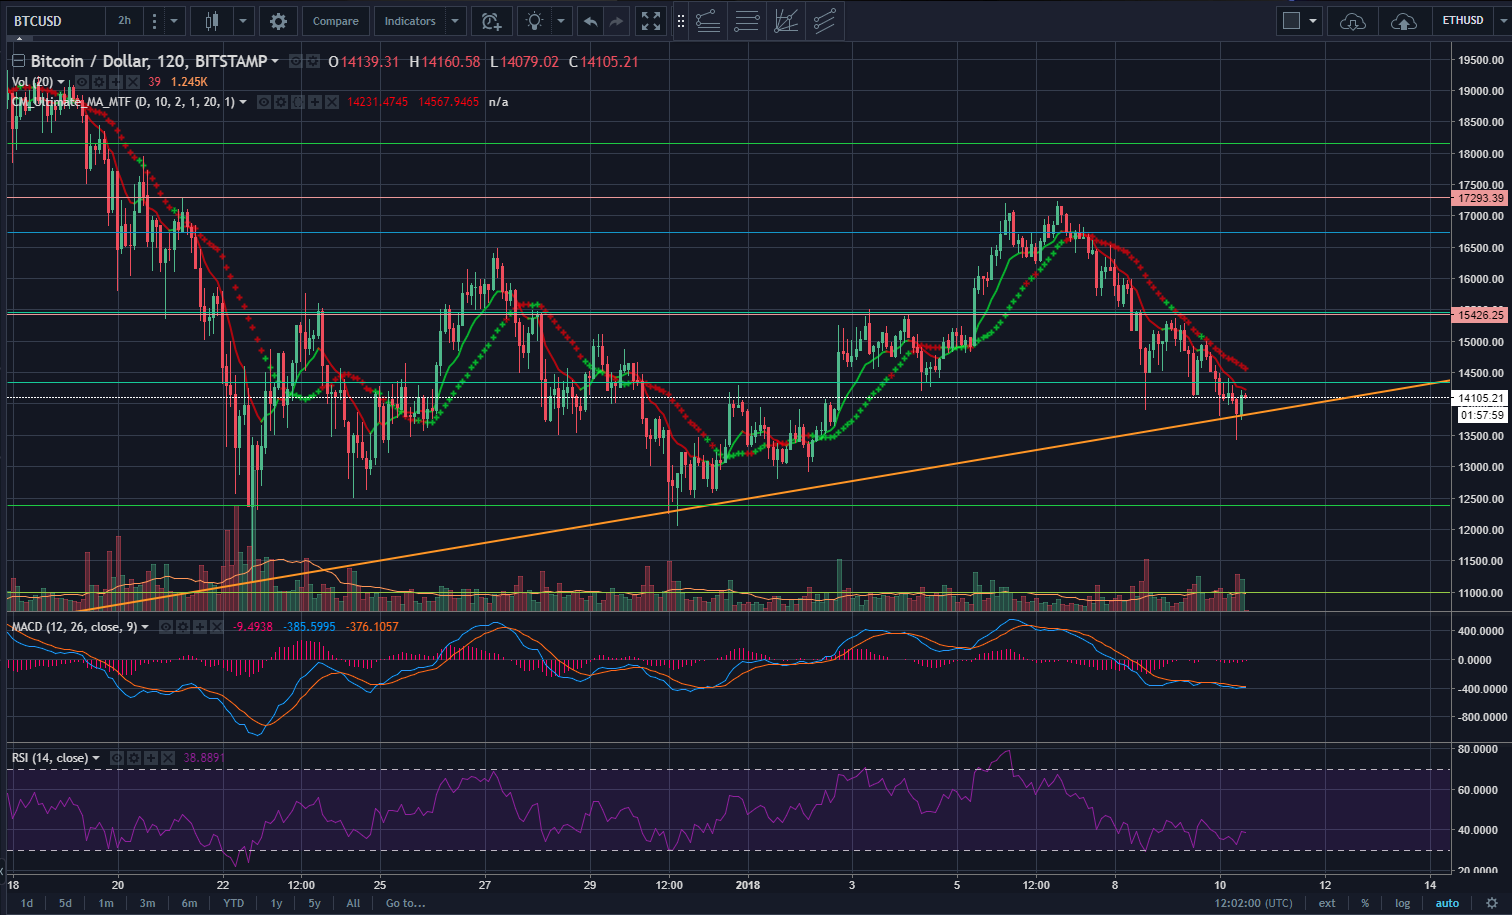
This chart is interesting
The RSI has touched the oversold line 3 times now in the last couple of days as bitcoin has made lower lows, so there is a bit of a divergence going on there which is saying the price decline is getting weaker.
I think we could see bitcoin bounce back from this sell off and follow the trend line.
Good luck!!!!
Hodl strong
Based on the recent chart, looks like BTC is consolidating for the time being. Once the consolidation is completed, another breakout to the upside can be expected.
Thank you very much for sharing your valuable post on steemit. I am going to follow you so that I can upvote your all post and Get notification when you post next article on steemit.
Thanks