CAN THIS PATTERN WORK ?
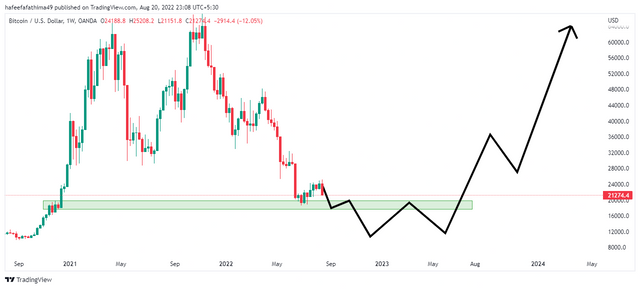
Today bitcoin breaks the last two weeks lows , so here i am expecting this pattern , Bitcoin may fall in to monthly demand zone the it will pull up again , BTC may fall in to 12000 areas , that is monthly demand zone. After reaching to that point btc may create a double bottom in daily or weekly chart , and btc will follow above picture . This is only my on view ,, you can comment below what about you ?