Bitcoin interpretation: Bitfinex BTCUSD (30 minute chart) 4th June 2018
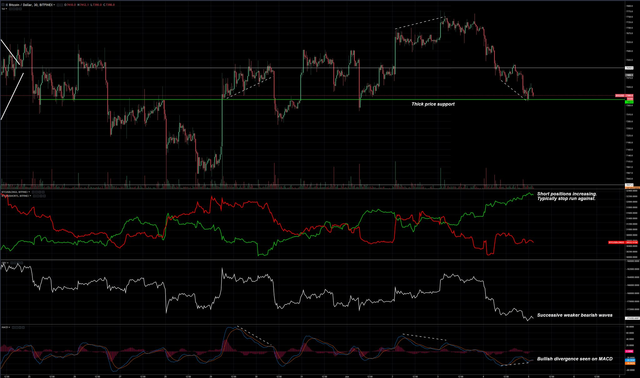
Bitcoin showing Bullish divergence here with weaking bearish waves both on price and volume. A MACD classic bullish divergence is also visible.
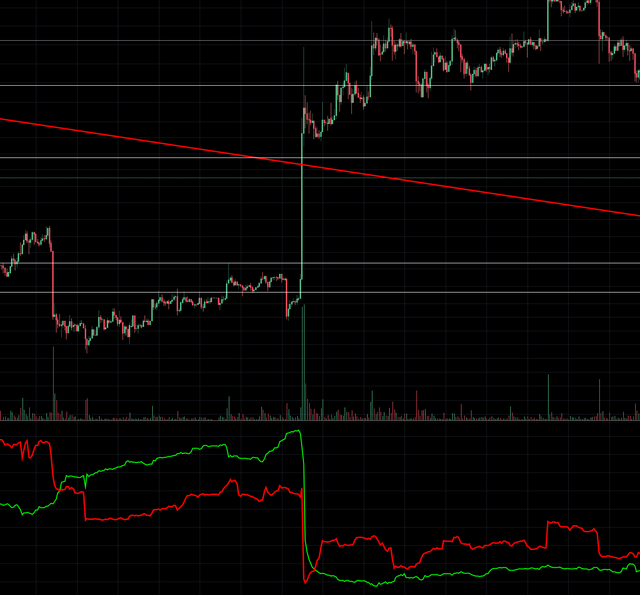
Contrarian traders are also frequently rewarded by counter-trading increasing Bitfinex short positions. Most notably the case at $6.8k where short positions fueled a $1200 price spike.
Optimistic in a long position here. Will personally be buying using dollar cost averaging down to ~$7k.
Legal Disclaimer: I am not a financial advisor. The information provided in this blog post and any other posts is for informational and entertainment purposes only. It is not investment advice. Consult a qualified financial advisor before investing. Do not invest more than you can afford to lose.
Up $200 since my post. Damn good start if I say so myself.
Thanks for you and most welcome boss..
Thank you very much sir..
Most welcome to sir@gentlebot..
Read my profile if want me to resteem your post to over 72,500 followers. @a-a-a
Congratulations @mrjozza! You have completed some achievement on Steemit and have been rewarded with new badge(s) :
Click on the badge to view your Board of Honor.
If you no longer want to receive notifications, reply to this comment with the word
STOP