Bitcoin price is currently below $2600 against the US Dollar, and it looks like BTC/USD may decline further and trade towards the $2320-2300 support.
Bitcoin Price Weekly Analysis BTC USD

Key Points
Bitcoin price struggled to settle above the $2775-2800 resistance against the US Dollar, and moved down.
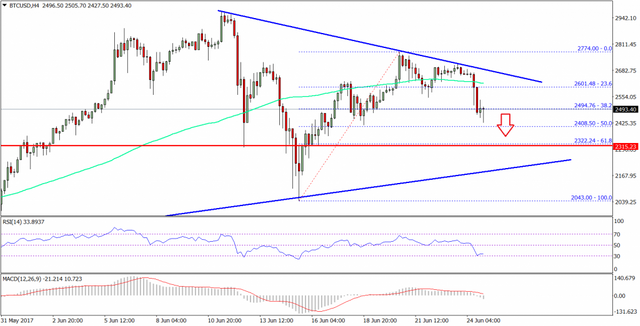
There is a crucial bearish trend line with resistance at $2680 forming on the 4-hours chart of BTC/USD (data feed from SimpleFX).
The price is currently under pressure and may head lower towards the $2300 support.
Bitcoin price is currently below $2600 against the US Dollar, and it looks like BTC/USD may decline further and trade towards the $2320-2300 support.
Bitcoin Price Resistance
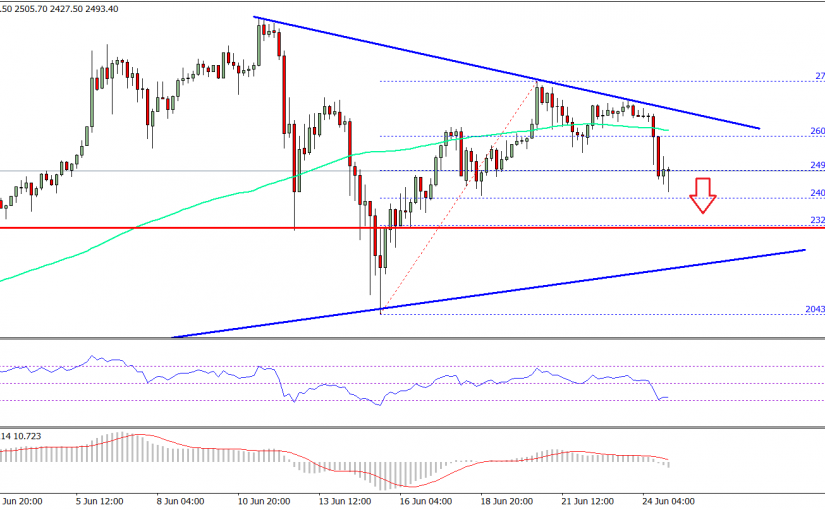
It seems like Bitcoin price is finding it hard to break the $2800 resistance against the US Dollar. The price tested the stated resistance on a few occasions, but failed to break it. There was a decline towards $2050 from where the price recovered well and surged above $2500. However, the price once again struggled to break the $2750-2800 resistance and moved down.
Actually, there is a declining bearish trend line with resistance at $2680 forming on the 4-hours chart of BTC/USD. It is acting as a giant resistance and preventing further gains above $2800. The 100 simple moving average (H4) is also below the trend line at $2620. So, we can say there are many hurdles on the way up for BTC near $2700 and $2800. It is once again trading lower and already breached the 23.6% Fib retracement level of the last wave from the $2043 low to $2774 high.
Bitcoin Price Weekly Analysis BTC USD

So, there are chances of further declines, and the price is likely to test the $2320 support. An intermediate support is at 50% Fib retracement level of the last wave from the $2043 low to $2774 high at $2408. On the downside, there is a connecting bullish trend line at $2250. It means if the price dips, buyers may take a stand near $2320-2250.
Looking at the technical indicators:
4-hours MACD – The MACD has started moving into the bearish zone.
4-hours RSI (Relative Strength Index) – The RSI is currently near the oversold readings.
Major Support Level – $2320
Major Resistance Level – $2700
Source: newsbtc
Charts courtesy – SimpleFX