Bitcoin market TA - Technical Analysis, are we really in a true bull run?
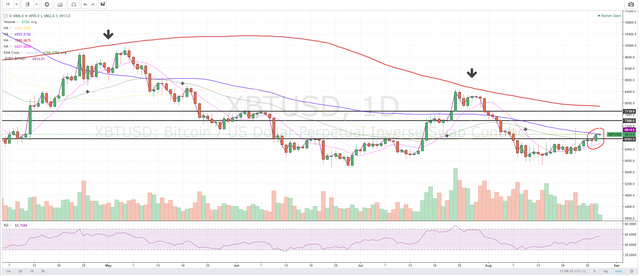
Ta shows that we broke through 6750 resistance. Now showing some resistance at the ma100 line (blue).
If we pass this ma100 line, our first resistance will be around 7400. Followed by a resistance at 7700.
Also check the ma200 line, which was showing some major resistance during previous dips.
I doubt we will be able to get into a bullish market this soon. I also doubt we can get higher than 7700. But if we manage to go above that it can result in a bull run.
The overal market on weekly signs shows we are still in a bearish trend. I don't know if we will break the 5800 - 6000 support level. But comparing overal bubble trends it's possible to reach around 5k and even 3k(exact TA will come soon for these levels, if necessary.)
For now we are good with alts. And be carefull around these levels I managed. With reversal in mind.
TA is no guarantee