Technical analysis Bitcoin Cash Wednesday 10, 2018

Today we bring a technical analysis for the Bitcoin Cash (BCH) which we see with a price above $ 2,400 but with a loss of -0.64% in the last 24 hours, which is not too much. The cryptocurrency is ranked 4 with a capitalization market of $ 40,653,278,250.
This type of technical analysis is of an educational nature and does not intend to represent an investment advice.
Key points in the analysis
- The price in BCH continues to trade at a range above the support of $ 2280 against the US dollar.
- The outstanding downtrend line of yesterday's trend with the current resistance at $ 2430 is intact on the BCH / USD time chart.
- The pair has to close above the resistance levels of $ 2450-60 to retreat in the bullish zone.
- The price of the BCH is quoted in a range above $ 2280 against the US dollar. BCH / USD could gain traction in the short term, but it has to break $ 2460.
Price support in Bitcoin Cash
A new phase of short-term consolidation began in the Bitcoin Cash price above the $ 2200 area against the US dollar.
The price was rising a few points towards the $ 2400 level, but had trouble gaining momentum. It seems that the level of retracement of Fib 38.2% of the last fall of the minimum of $ 2730 to $ 2250 minimum prevented gains and an upward jump.
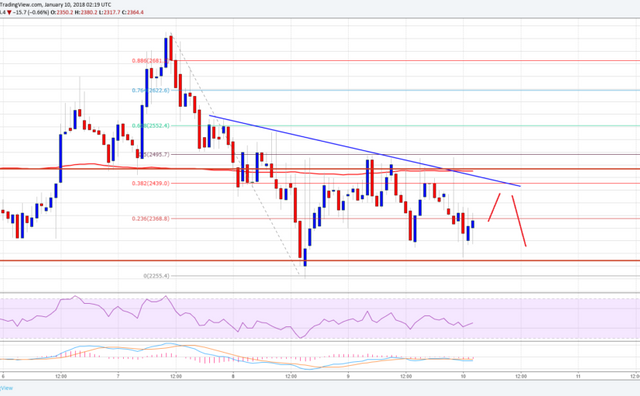
More importantly, the outstanding bearish trend line yesterday with the current resistance at $ 2430 is intact on the BCH / USD time chart. The pair was continuously offered around the resistance of $ 2450 and the simple moving average of 100 hours.
There was also a peak towards the 50% retracement level of the Fib in the last fall, from the maximum of $ 2730 to the minimum of $ 2250. However, there was no bullish break nor a close above the levels of resistance of $ 2450-60.
The pair has to move above the aforementioned resistance area of $ 2450-60 to gain traction. Once BCH retreats in the bullish zone above $ 2460, it could try a run towards the $ 2700 level. On the downside, the most important range support is around $ 2260-80, which should be maintained to contain losses.
Technical indicators used
- MACD per hour: the MACD for BCH / USD is struggling to retreat in the bullish zone.
Hourly RSI (relative strength index): the RSI for BCH / + + USD is currently well below level 50. - Main support level: $ 2280
- Higher resistance level - $ 2460
Bitcoin cash has bounced good in btc value and it has a trend to break higher and higher when it does.
The ultimate authority must always rest with the individual's own reason and critical analysis.