Below $7K: Bitcoin Price Looks Indecisive After 19-Day Low

Bitcoin’s (BTC) price is trading in an indecisive manner after hitting 19-day lows below $6,900 on Sunday, but could pick up a bid on acceptance above $7,100, technical studies indicate.
The leading cryptocurrency fell to $6,890 on Bitfinex yesterday – its lowest level since July 17 – before ending the day (as per UTC) on a flat note at $7,025.
The price action indicates BTC lacks clear bias, but could also be considered a sign of bearish exhaustion, as the prices have already made a 21 percent slide from the recent high of $8,507.
If the bulls are able to push prices above Sunday’s high of $7,090, then a minor corrective rally could be in the offing. On the other hand, a slide below the previous day’s low of $6,890 would revive the bearish view.
At press time, BTC is trading at $6,975 – down 0.80 percent on a 24-hour basis.
Daily chart

The above chart shows, BTC created a doji candle (marking indecision) on Sunday at the 50-day moving average (MA) support, making today’s close (as per UTC) pivotal.
A bull doji reversal would be confirmed if BTC closes today (as per UTC) above $7,090 (Sunday’s doji candle high). In this case, a corrective rally to the 100-day MA, currently located at $7,474, could be seen.
Meanwhile, a close (as per UTC) below $6,890 (Sunday’s doji candle low) would signal a continuation of the sell-off from the July high of $8,507.
If the bulls fail to force a rally soon, the focus would quickly shift back to the bearish factors: downward sloping 5-day and 10-day MAs, the breach of the key support of 100-day MA last week and a bearish relative strength index (RSI).
Further, BTC’s close proximity to the all-important inverse head-and-shoulders neckline support (former resistance) of $6,820 is another big reason why the bulls need to make a quick comeback.
A move below $6,820 would invalidate the bearish-to-bullish trend change confirmed by the inverse head-and-shoulders breakout on July 17 and would shift risk in favor of a drop below the rising trendline (yellow dotted line).
Weekly chart

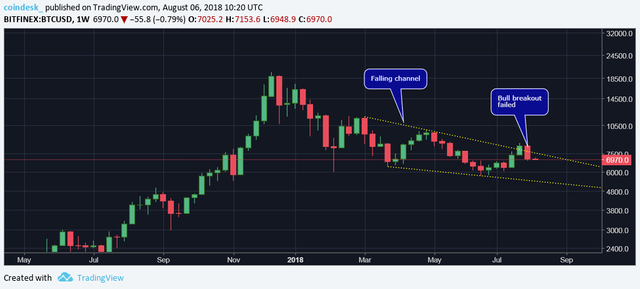
As seen on the above chart, the long-term bullish view has been invalidated by BTC’s close at $7,025 yesterday.
BTC closed above the falling channel resistance in the previous week, seeming to confirm a long-run bearish-to-bullish trend change. However, the breakout ended up being a bull trap [comma] as the cryptocurrency fell back inside the channel last week, invalidating the long-term bullish outlook
View
BTC could rise back to 100-day MA of $7,474 if prices close today above $7,090. That said, the short-term bias would remain bearish as long as the 5-day and 10-day MAs are trending south.
A close today below $6,890 would increase the risk of a drop below the key rising trendline support, currently seen at $6,700.