Bitcoin Trend / No. 510 / The Trend Map
Time: 8.25 A.M. / GM+2 / 27th Feb, 2018 – Tues.
As I wrote in my last post / 509 / we made Bitcoin Trend simple, to understand my thoughts and ideas on the subject of trend which may be used as a tool.
All of us know, that bitcoin's last leg down was directly caused by Japan and South Korea as Japan has been totally dominating the market and even the run-up from February 6th to the 17th was caused by Japanese buyers.
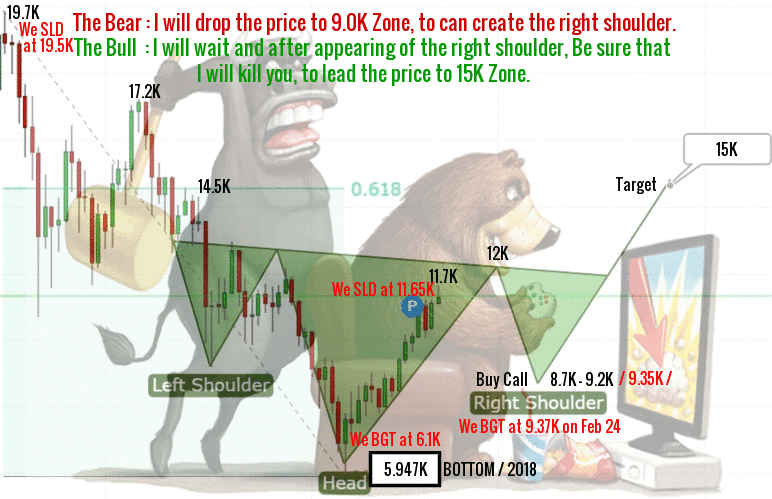
The bellow pattern / reverse H&S / looks ready ( is in the middle ) to confirm the potential climb, around 5000$ toward 15K.

Bitcoin price might retest the area between 9.5K and 10K, followed by upside continuation above 10.5K, to hit 10.75K, to be able to break the weak resistance at 11.7K opening the way toward 12.8K to hit the target 14.5-15K, on the end of March.
Bitcoin is currently trading around 10.26K at time of writing and the trend for today is bullish, supported by:
- 100 SMA is above 200 SMA so the upside move is more likely to continue.
- Stochastic is on the move up to suggest that buyers have the upper hand.
- RSI support the bullish pressure.
Support : 9500.00 level (Major).
Resistance : 11000.00 level (Major).
Expected trading for today:
is between 9500.00 support and 11000.00 resistance.
Expected trend for today :
Bullish.
Medium Term:
Bullish.
Long Term:
Bullish.
The low of 2018:
5947.00 / IHS Bottom.
The high of 2018:
25000.00 level / Expected.

About one year ago I wrote here on steemit:
"Remember the lucky times when you could buy one BTC for only one ounce of gold".
Today I can write:
"Remember the lucky times when you could buy one BTC for only 10k of USD".
I think we are really in the last days when this cheap price of 10k is awailable.
I agree fully with you my friend..
Soon will see the 14.5K-15K..
I hope the others, that can see what we see !
Wish you a great day..
it has been holding on $10000 for a while now , hope it breaks into $11000 and that it when the bull run begins, i was hoping it will climb last week when it reached $11000 but it slid back to $10000
Great post!
I was looking forward to your update 2-3 hours ago. Hope you can update once more time today :)
Thank you for collaborating with me to promote this post as explained at https://steemit.com/steemit/@jerrybanfield/10-ways-to-fund-a-steem-growth-project.
What is full meaning of SMA? I just heard about this.
The simple moving average. The closing price of bitcoin (or any coin, stock, commodity) over a certain period averaged out. Price on each day / the number of days. Most exchanges will have an SMA line on the charts that you can access
bullish trends are back and people now will all go bonkers due to the FOMO
A good thought about the bitcoin trend in today @lordoftruth
very informative as usual.....I am still waiting of BTC go down below $9k to buy again.....when would it go down if ever to below $9k?
Didn't you buy during huge dip to the 6k? There was plenty of time to buy under 9k...
Very elegant way to present you, The truth is in all your words.
It is possible to get many useful examples from your writing. well done and keep it up.
post a very good friend I really like friend if there is time please visit my blog.
Hahahah... Did you read the post??