Bitcoin Trend / No. 500 / Bullish With Small Bearish Divergence
Thank you for your support and for
honoring me with your upvote.
Many thanks also to @famunger for the daily sharing of my link
on his posts, for his hard work and the daily judgement call that he make.

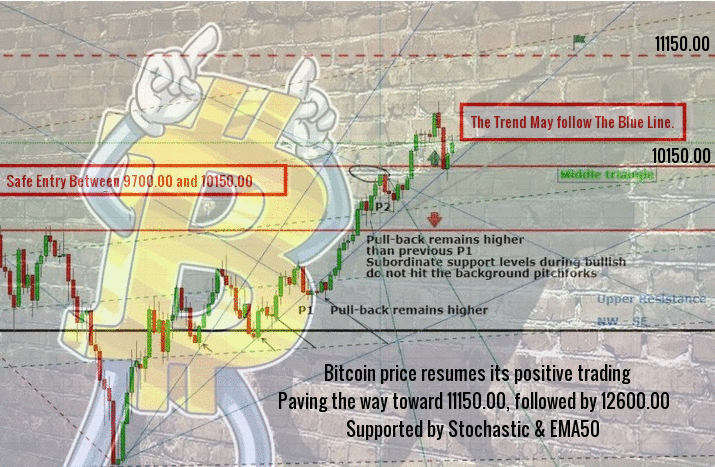
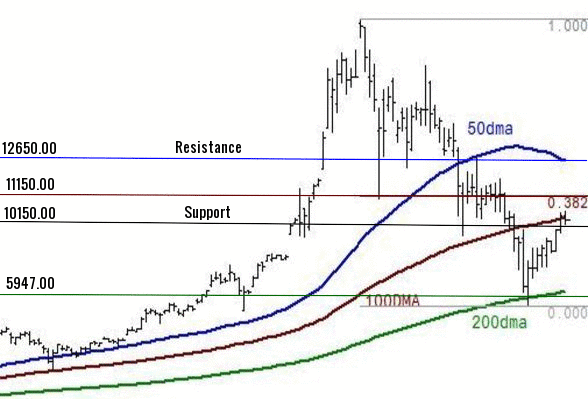
Expected trading for today is between 10150.00 support and 12650.00 resistance
As expected, The Natural Progress from the support 10150.00 pushed the price above 11150.00 ( 100 DMA ) to reached 11500.00 level few hours ago, and might lead the price to 12650.00 ( 50 DMA ) followed by 12850.00 ( 38.20% Fib Extention ) affected by inverted head and shoulders, and supported by :
- 4-hours MACD.
- 4-hours RSI.
- 100 SMA is above 200 SMA so the upside move is more likely to continue.

Bitcoin price now, is around 11500.00 level and the trend for today is slighty bullish.
Note, stochastic indicate, selling pressure might return soon ( bearish divergence ). The reason, why I think the upmove will be limited today to 12000.00 level.
Expected trading for today:
is between 10150.00 support and 12650.00 resistance.
Expected trend for today :
Slighty Bullish.
Medium Term:
Bullish.
Long Term:
Bullish.
The low of 2018:
5947.00 / H&S bottom.
The high of 2018:
25000.00 level.

Great analysis - you nailed it again. I also was fascinated how confident you were very early on about the bottom.
And thank you for your continuous support and resteem. It is highly appreciated.
Thank you..
I am so sorry for my small upvotes, as I did not have steem power as in past.
By the way I changed to slighty bullish due some bearish divergence that was created by stochastic.
To be honest I do not like this bearish divergence, as might lead to a big drop from 11700.00 the top of today or from the 12000.00 level. ( No new bottom. Do not panic ).
I can not confim this yet for now.
I need sometime to can come with new update and with new buy call.
Yes you are right , when most of analysts over the net, was bearish I confirmed the bottom and I went up with a call buy at 6.1 k ( close to 5.947 K ) before 5 days, and I went bullish.
A big surprise ( good one ) might be in the next updates.
Please contact me by steem chat today to can keep you informed, when I have new update before posting.
Hi lordoftruth
I am just reading your comment. Sorry for not having the chance to get in contact before I posted my update. I am traveling at the moment so it is already a challenge to keep the pace of bringing the daily update. I give you my telegram on steemchat that would work for me easily if we need to connect. Make sense to get in contact anyway - would like to talk about potential improvements I am planning on the update and would like to get your opinion on that (but that will be after I am back home and that is by end of this month).
I am really interested in the "good surprise" you have ....!
Have a safe travel..
Never is so late..
Will speak after you are back home..
Yes, about improvement and on the same time about trend ( as sometime I need to discuss with you before posting when I expect a big move or buy call ).
My last buy call at 6.1K gave a profit 5500$ per bitcoin ( I SLD at 11.65 K )
The next buy call will make a profit around 5500$ per bitcoin also.
This is the surprise.. I Think is good one..
I will let you informed..
Need sometime to come up with the new call..
Have a great day..
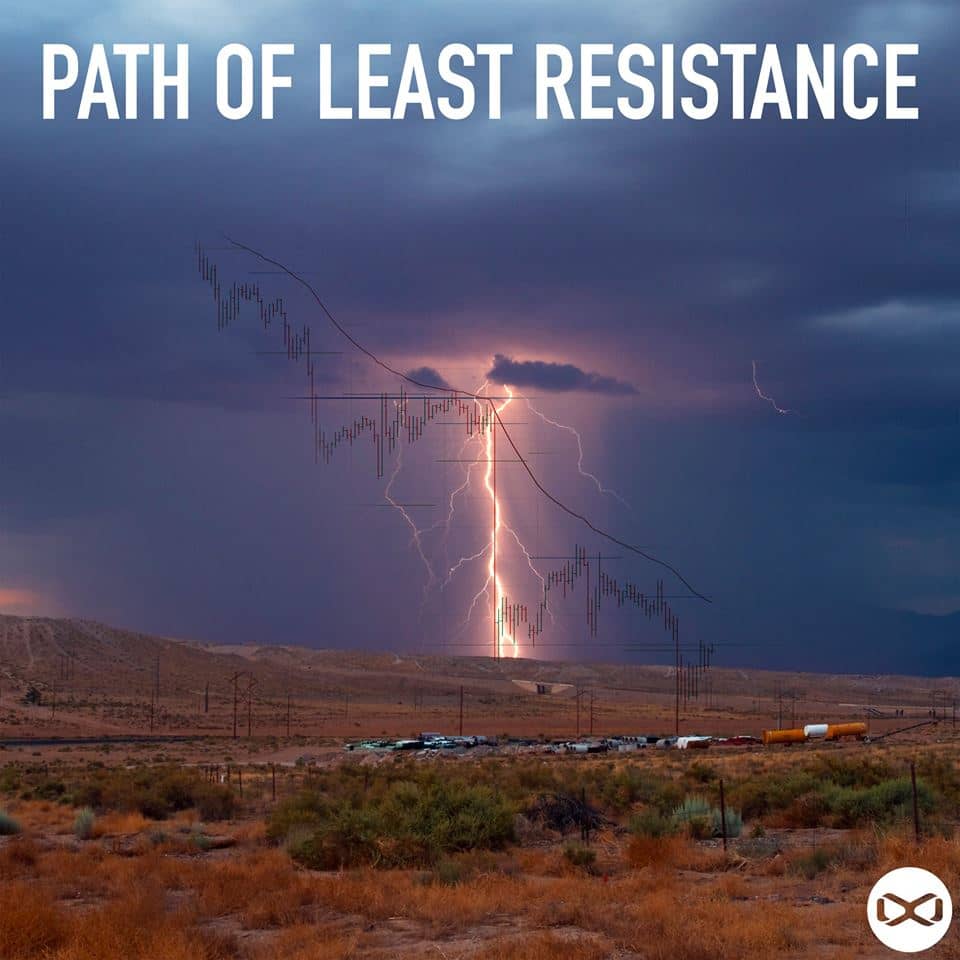
I can see that you have been expecting a new all time high at $25,000 this year. But I want to ask your opinion about this one. I don't really know much about technical analysis, but is it really possible to compute for the path of least resistance or is this pure speculation?
https://twitter.com/onemanatatime/status/964518046713851904
Thank you in advance.
(image is not mine)
I checked the chart..
The price might go there ( I mean the top )
No one know exactly how much will be ( but likely around or above 25K )
I understand that you are studying the charts to analyze the trend. But the photo I posted is from another person I just saw on Twitter. I just want to know if there is a thing called "path of least resistance" in technical analysis or this person just drew some random lines on the chart? hehe
Yes

In trading some use "The Path of Least Resistance"
Oh, I see. Thank you for taking time to answer my questions and for providing great market insights! :)
Its good news that bitcoins reached 500 post and also Charts shows that price is going up and hope it will goo more and more up Thanks for sharing more and more information about this keep it up
@lordoftruth, thanks for explaining the graph.lol. Graph hasn't been my thing from college days.
bitcoin getting its place back. that i am sure.
your posts are golden..yeah.. i thik post might have its advantages as well as & specilly thanks for sharing.....
I think we will see a huge run of BTC now, and when it reaches new highs people will invest in the alts. So, just HODL :)
Good to see some life in it...
Bitcoin long bullish trend is good news as bitcoin tend to affect most major cryptos, thanks for your analysis @lordoftruth.
Your information is on point, but I hope that 25k high is wrong 35k would be alot better. Also how do you get them kool badges made for your account?
Thanks for share information about BTC.