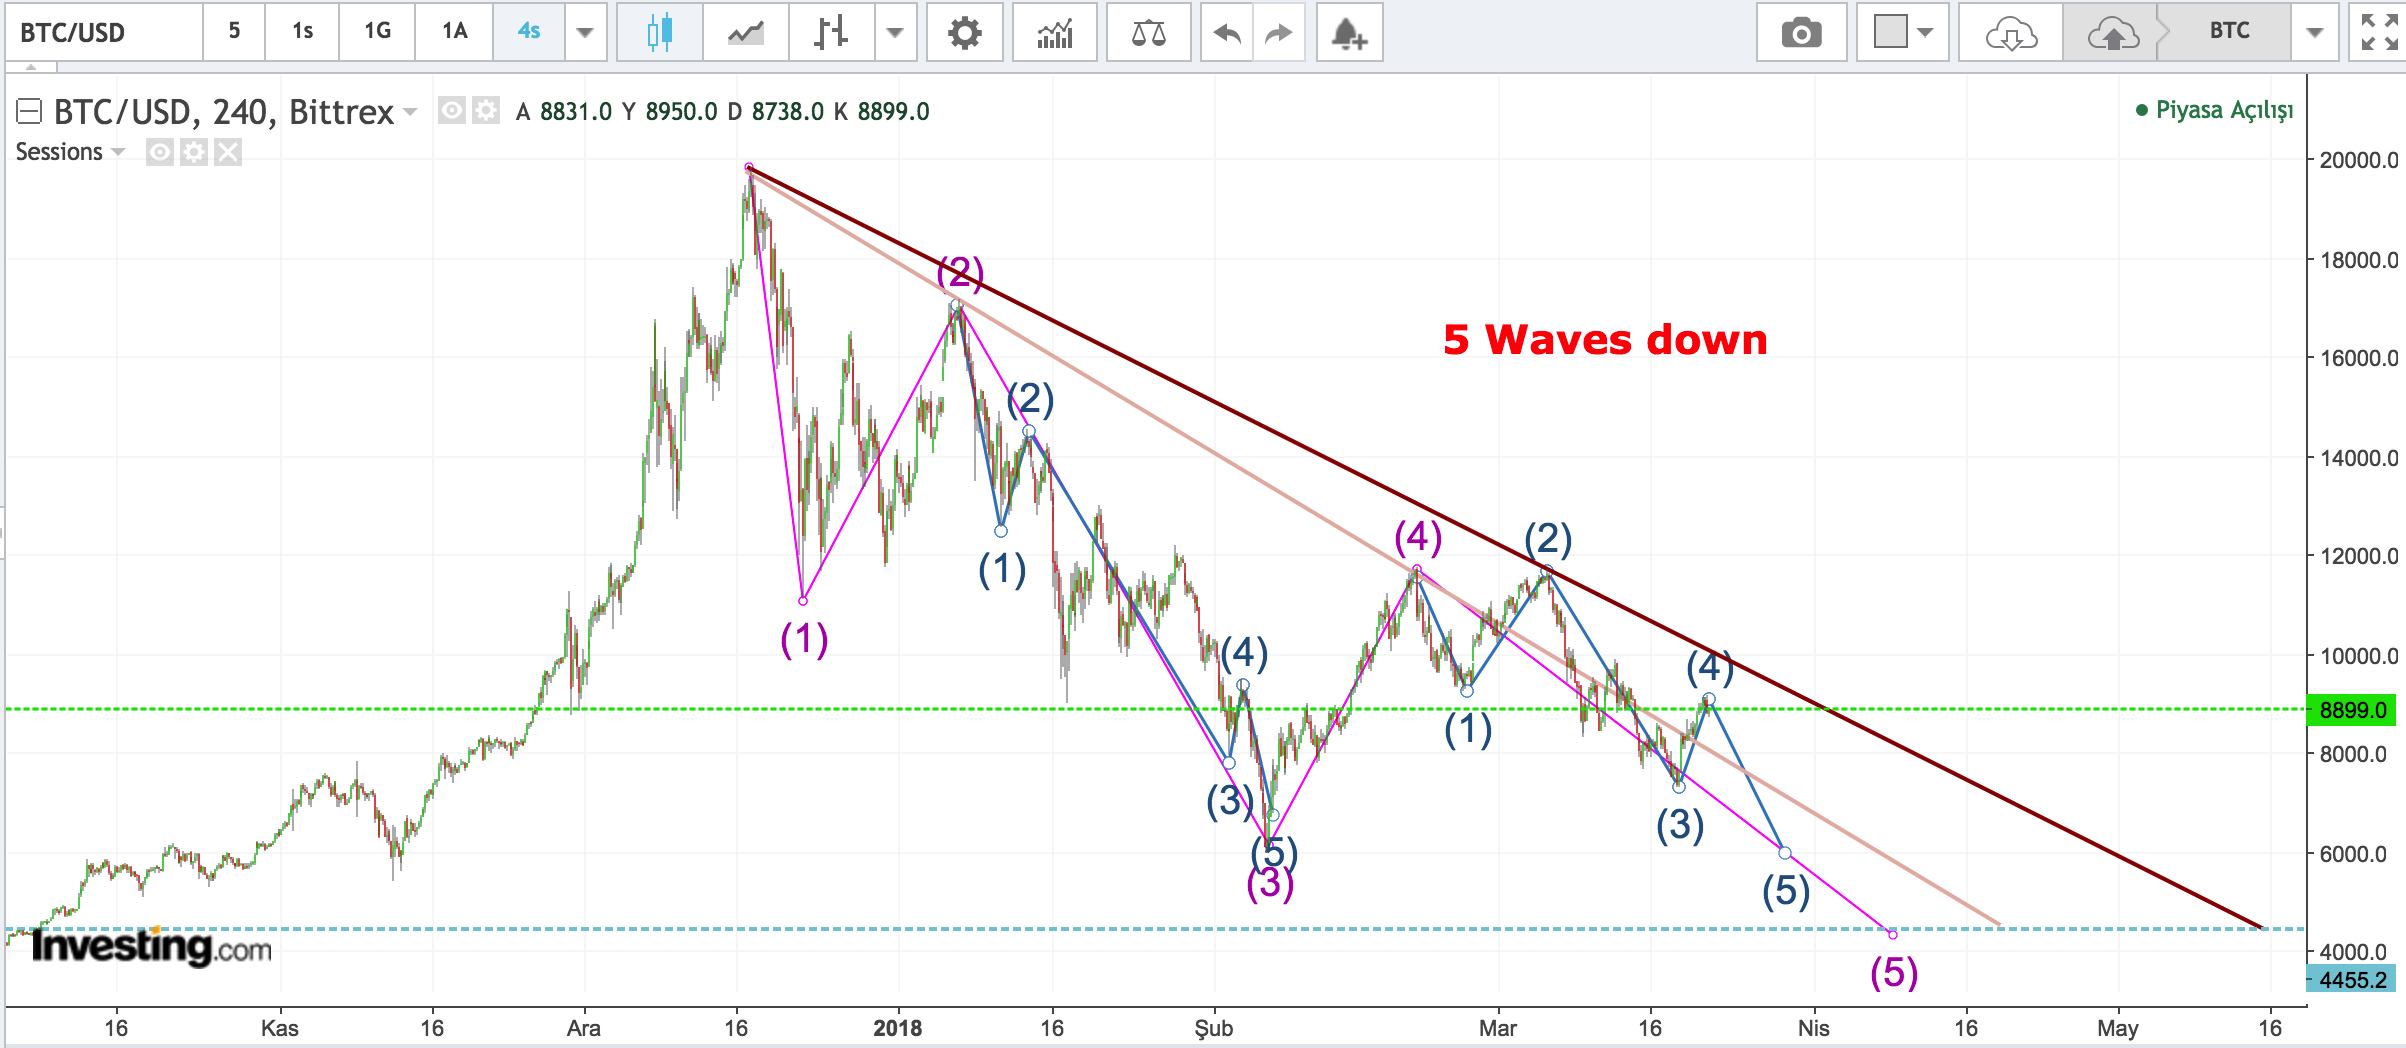
I seen someone else post a very similar count and it does look good even though I'm not big on Elliot Wave Theory... I do believe we go down further yet and so you could very well be right with that count :) @leventuzun
I think you might be interested in this one too, just to show you a finished cycle:
Go to tradingview.com and search for Amazon (AMZN)
Put it on a Weekly chart and go all the way back to 1999 - 2002 (auto)
Check out april 2001 and oktober 2001
Overall, look how similar the chart looks with BTC (althoug things now aday's happen a lot faster)
Bitcoin has been sideways since Mid Jan. If it breaks $6000, I agree with your chart the price goes lower. However, if it breaks $12000, the price will go up. I don't see it going below $6000. I believe if it was to get this low, the buyer would step in because they would see that price level as being a huge discount. I hope this helped.
As you can see from reality, my thumbsuck prediction is far exaggerated. I guess it also depends of what sort of term you're looking at. I tend to invest long-term and I don't swing trade, so little fluctuations in price don't bother me.
I seen someone else post a very similar count and it does look good even though I'm not big on Elliot Wave Theory... I do believe we go down further yet and so you could very well be right with that count :) @leventuzun
:) thanks..
I think you might be interested in this one too, just to show you a finished cycle:
Go to tradingview.com and search for Amazon (AMZN)
Put it on a Weekly chart and go all the way back to 1999 - 2002 (auto)
Check out april 2001 and oktober 2001
Overall, look how similar the chart looks with BTC (althoug things now aday's happen a lot faster)
Leventuzun
Bitcoin has been sideways since Mid Jan. If it breaks $6000, I agree with your chart the price goes lower. However, if it breaks $12000, the price will go up. I don't see it going below $6000. I believe if it was to get this low, the buyer would step in because they would see that price level as being a huge discount. I hope this helped.
Thoughts???
Thanks!
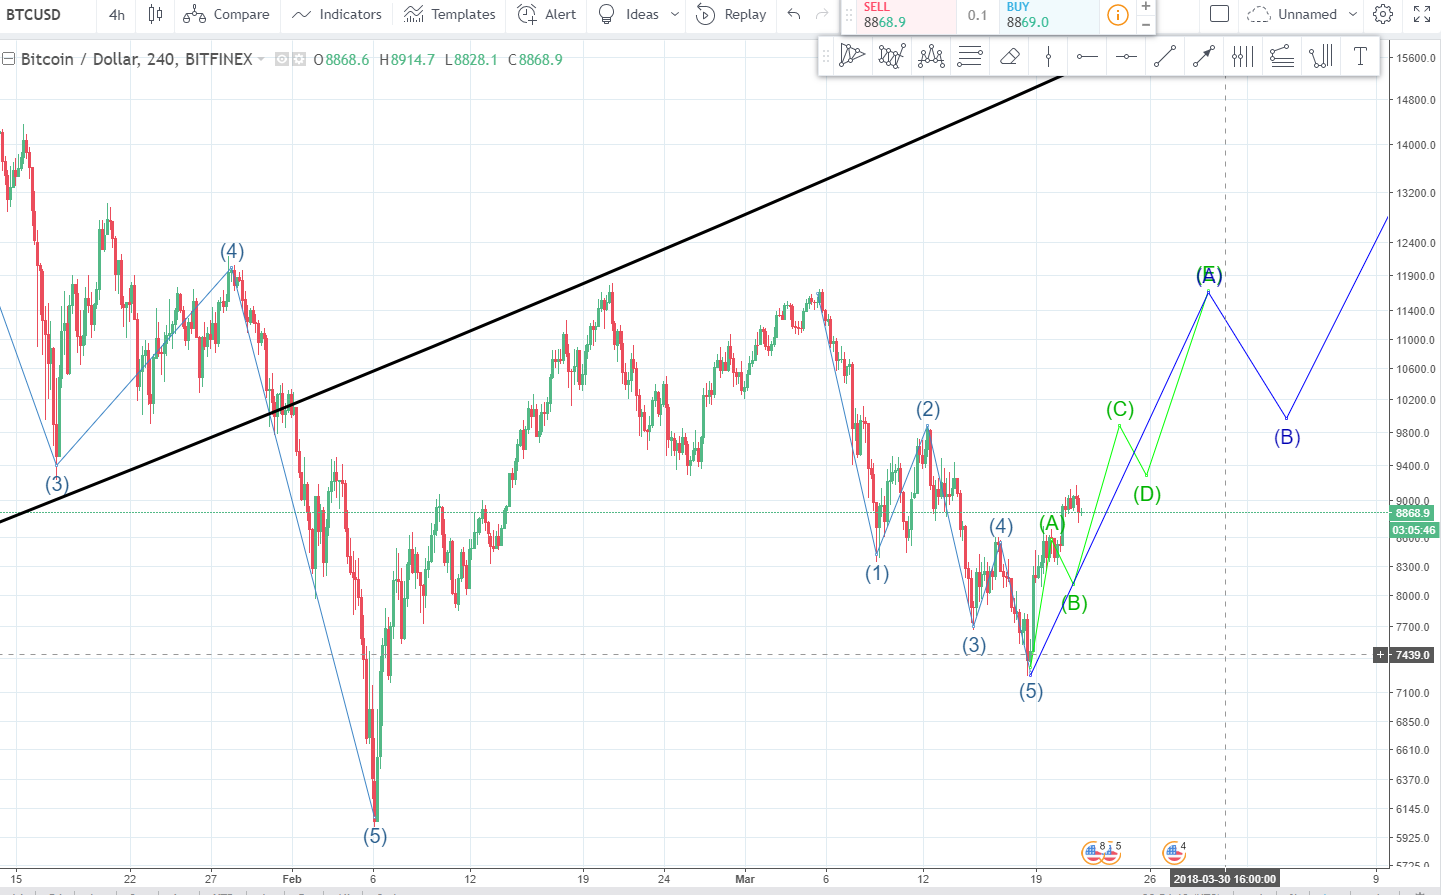
I disagree with your wave positions. If it helps at all, mine looks like this. (Done a day back so not everything lines up nicely). Hope that helps.
Thanks for the perspective.
Doesn't make sense: Your green A to B already calls you out on your own chart
As you can see from reality, my thumbsuck prediction is far exaggerated. I guess it also depends of what sort of term you're looking at. I tend to invest long-term and I don't swing trade, so little fluctuations in price don't bother me.
I wish you MAAAAAAASSSSSSIVVVE PROFITS!!
This doesn't help, but thanks.
hey there click on my link to earn 2000 per month free vote and tell me if you like it
https://steemit.com/money/@wolf92/easy-job-from-home-earn-at-least-2000-dollers-per-month
Please advertise more on @Haejin's blog. Don't use the promotion section. That cost you SBD.
hey there click on my link to earn 2000 per month free vote and tell me if you like it
https://steemit.com/money/@wolf92/easy-job-from-home-earn-at-least-2000-dollers-per-month
Please advertise more on @Haejin's blog. Don't use the promotion section. That cost you SBD.