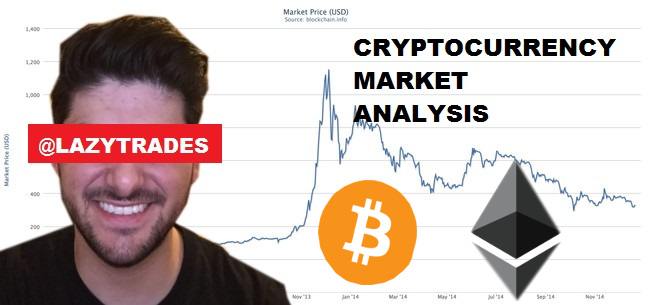
Cryptocurrency Market Analysis 07-17-2017: Everything you need to know right now!
Dear Lazytraders,
We corrected the moves to the downside slightly and I dont want you to get panic at this point. Its just how trends work. Movement and Correction always rotate. A correction doesnt mean that there is already a countertrend but is a indication of a healthy trend. Dont draw your conclusions too early because right now we dont really know which direction its gonna take. We got to wait for the daily closings and draw our conclusions from there. We also have to look at the picture the Chart is showing. I draw up 3 examples on how the chart can move from now on so that you can relax your mind and dont move too quick for now. The drawings will be at the end of this Blog Post.
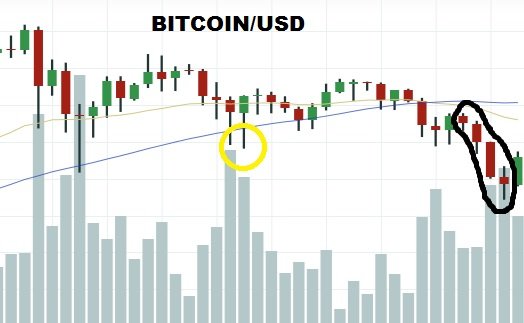
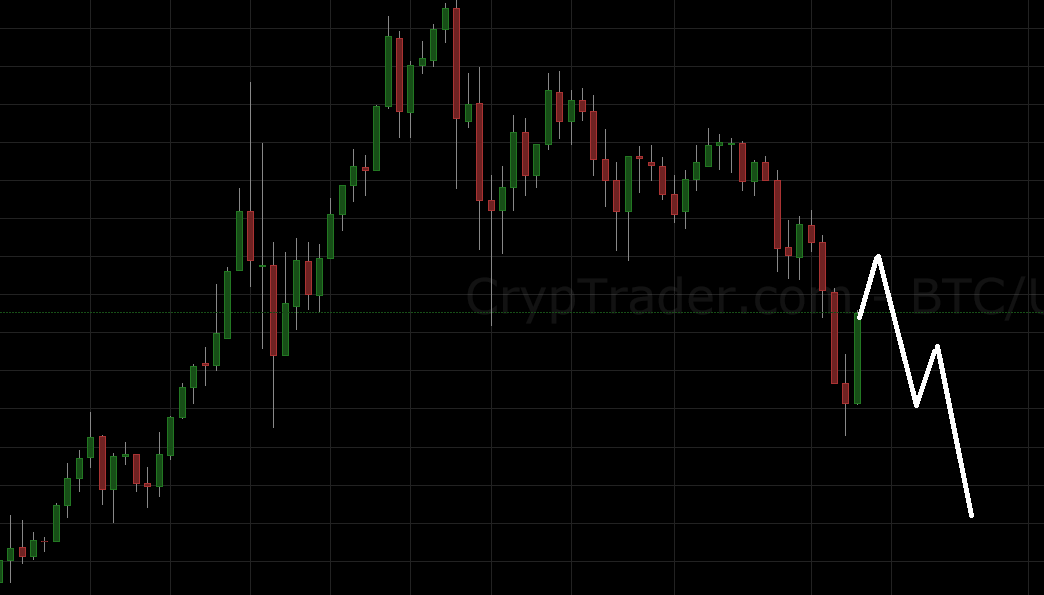
Poloniex Chart, Timeframe 1DAY=1CANDLE, Price at the moment 2110 USD
OVERVIEW BITCOIN
Bitcoin started to correct the last move to the downside which I have marked with a black lining. The correction will have slight difficulty to daily close above 2168 USD which is proven previous support which turns into resistance. If it goes through and daily closes above 2168 USD then there is a slight possibility of a countertrend to the upside because resistance would turn into support again.
NUMBERS
If we close above 2054 USD the correction continues into 2168 USD.
If we close below 1835 USD we will continue to the downside into 1568 USD.
If we close inbetween those numbers we will move sideways.
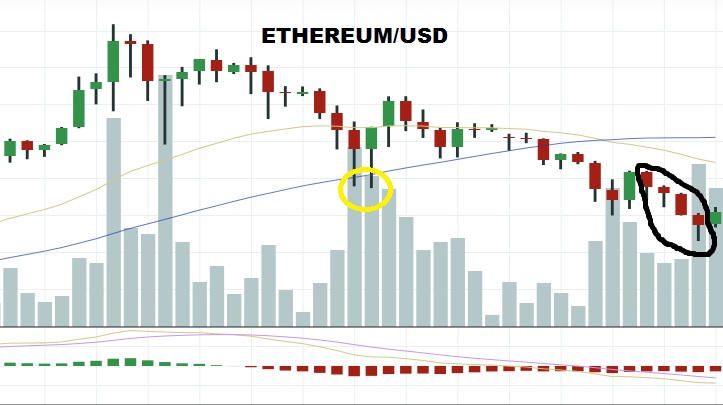
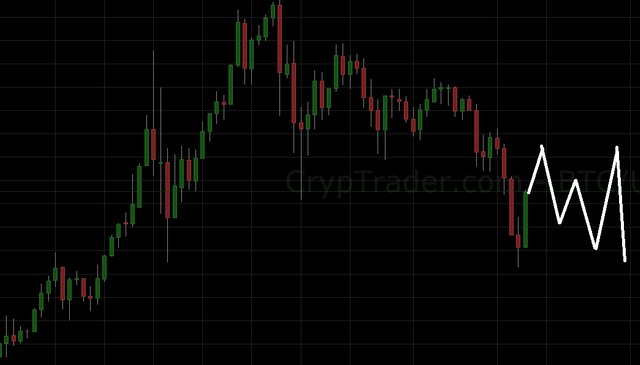
Poloniex Chart, Timeframe 1DAY=1CANDLE, Price at the moment 173 USD
OVERVIEW ETHEREUM
Ethereum also started to correct the last move to the downside which i also marked with a black lining. The correction can continue into 204 USD which proved to be resistance. The price will struggle at that point but if it goes through and daily closes above 204 USD then there is a possibility of a countertrend to the upside because resitance would turn into support again.
NUMBERS
If we close above 173 USD we will correct further into 204 USD.
If we close below 138 USD we will continue trending down into 100 USD.
If we close in between those numbers we will move sideways.
EXAMPLES OF HOW THE CHARTS CAN PLAY OUT
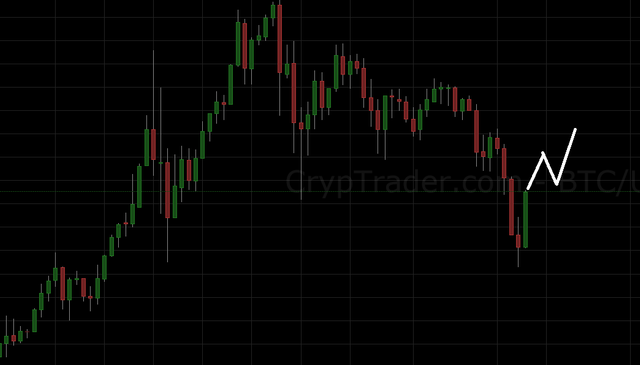
Countertrend
Downtrend Continuation
Sideways Continuation
I hope this kind of information helps you guys. Never panic and always plan ahead. Dont make the mistake of not preparing for stuff like this. You have to be prepared for everything in the Markets you got to adapt like water and absorb like a sponge!
Dont let anything discourage you, just learn your stuff and move ahead. If something happens and you dont know the answer it means that you didnt prepare well enough.
**If you want me to analyze another markets just let me know in the comments below.
See you next time :).
Disclaimer: Im not promoted or paid for to use certain tools nor is this investment advice its just my perspective on the markets and thus just for educational purposes.

meep
Meep
meep
Meep
meep
Meep
Meep
meep