Bitcoin(BTC), Chart Trading Study in 12th July.
Hi~^^
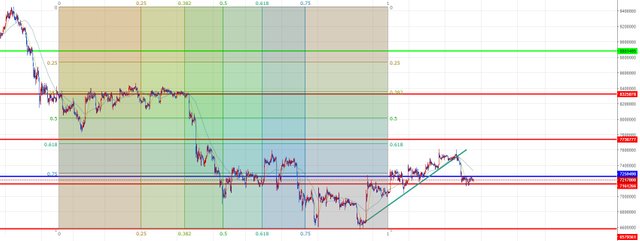
- 1hour candle chart
I said my target was $8,000.
The trend continued to rise and the trend broke.
It can draw a line of green lines.
Don't worries.
I think It's running stop for a while.
It's called adjustment.
Now It staying on the resistance line of the blue line.
It is also the resistance zone, and Fibonacci is about 33%.
Nowadays, coins fall, so it's not funny.
When the time comes, It will move again dynamically.
It is most likely to move on a chart.
It will be a little lull.
** Disclaimer: This post is a personal idea, not an investment idea. The transaction is a small transaction, so please enjoy it. It is your responsibility to invest, and you should be aware of subjective judgments and technical analysis to make investments.