Bitcoin(BTC), Chart Trading Study in 8th July.
- I am analysis only downward trends.
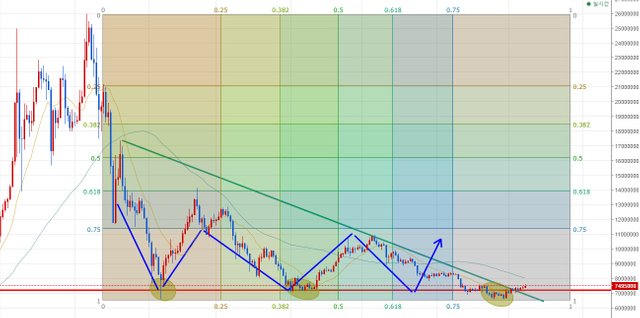
- 1day candle chart
It is access by mid-term trading. Currently, it is a triple bottom. It is a part marked with an ellipse.
Set the first peak to $19,000. It did not come up to the center until the peak point. It need more time.
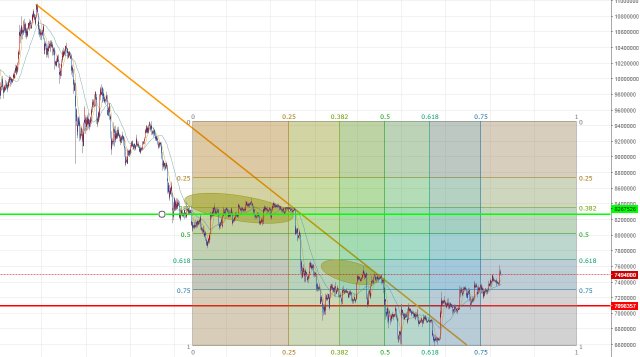
- 1hour candle chart
It has been a trend transition since it dropped from the peak point. How far will set it target price?
It is divided into two parts marked with an ellipse. It is the highest points of previous.
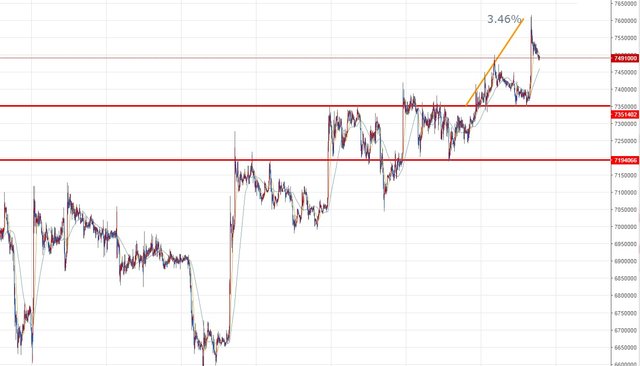
- 10minute candle chart
In the short term, it breaked the peak. It is expected to drop to support of $7,350.
It approach the target price shortly to the peak. There is a resistance of red line. Can expecting it?
** Disclaimer: This post is a personal idea, not an investment idea. The transaction is a small transaction, so please enjoy it. It is your responsibility to invest, and you should be aware of subjective judgments and technical analysis to make investments.
Hi. I like your content! I just upvoted you and follow you! Can we be friends? I interested cryptocurrency and trading.
Yes. We are friends. I will follow you. I hope you find it frequently.^^