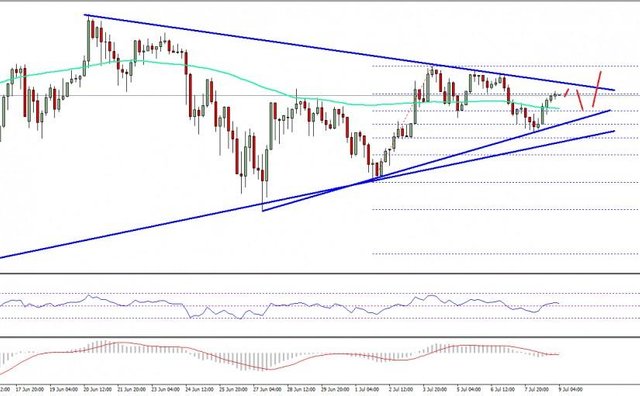
Bitcoin Price Weekly Analysis
Key Points
Bitcoin price traded in a range above the $2400 handle against the US Dollar, and looking for a break.
There is a monster breakout pattern with support at $2420 forming on the 4-hours chart of BTC/USD (data feed from SimpleFX).
On the upside, a break above the $2600 is needed for the price to gain bullish momentum.
Bitcoin price is heading towards a crucial break against the US Dollar, and for gains BTC/USD has to settle above $2600 in the near term. 
Bitcoin Price Breakout Pattern
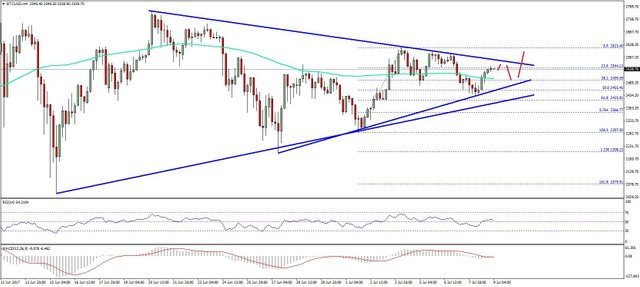
There were swing moves in Bitcoin price below the $2650 level against the US Dollar. The price was mostly seen struggling to gain traction above the $2650-2700 levels. It traded as high as $2623 where it faced sellers and started moving lower. It traded down and broke the 38.2% Fib retracement level of the last wave from the $2287 low to $2623 high. There was also a break below the 100 simple moving average (H4) and $2500.
However, the price remained above the 61.8% Fib retracement level of the last wave from the $2287 low to $2623 high and recovered. It is currently trading above the 100 SMA and $2500, but facing a major hurdle near $2550. There is a monster breakout pattern with support at $2420 forming on the 4-hours chart of BTC/USD. The breakout resistance is near $2550-2600. A close above $2600 is needed for buyers to gain momentum.
Bitcoin Price Weekly Analysis BTC USD
On the downside, the price must hold the triangle support at $2420-2400. A close below $2400 might be a short-term trend change and the price could slide back towards $2000. To sum up, we can keep monitoring the pattern and look for a break above $2600 or below $2400. 
Looking at the technical indicators:
4-hours MACD – The MACD is attempting to move into the bullish zone.
4-hours RSI (Relative Strength Index) – The RSI is now above the 50 level.
Major Support Level – $2400
Major Resistance Level – $2600
I think at this point the upcoming segwit2x is more important for the price then any analyses