Bitcoin Price Analysis June.1--Consolidation Before Bullish Run
Some thoughts on BTC:
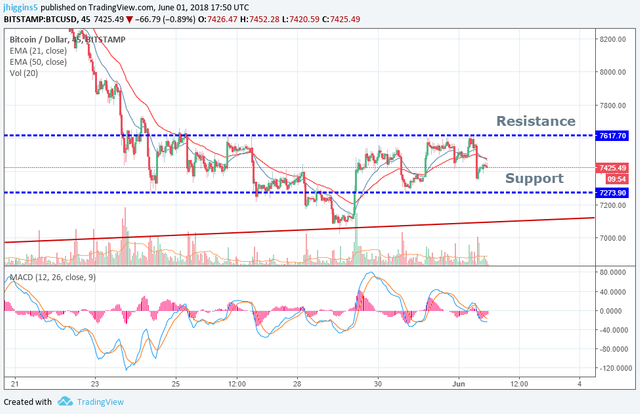
Bitcoin is consolidating inside a narrow trading range as it completes an inverted head-and-shoulders pattern. The chart below marks lower support around $7300 and upper resistance around $7600. Current prices seem to be forming a small bear flag, which could break lower and test support again around $7300. Still waiting for bulls to push BTC above the trading range.
The red line in the chart below represents a long-term trend line, which the "head" of the H&S pattern tested recently.
Any thoughts?

Hi, thank you for contributing to Steemit!
I upvoted and followed you; follow back and we can help each other succeed :)
P.S.: My Recent Post