BTCUSD Technical Analysis UPDATE @ $7779 - Feb 7th 2018
Carrying on with the horizontal support/resistance zones from my last post. https://steemit.com/bitcoin/@jagr/btcusd-technical-analysis-update-usd7412-feb-6th-2018
Quite a bit of text here, but I'm going through my BTC/ETH accumulation plan below in detail so we have the foundation and purpose laid out regarding what I'm doing with my life.
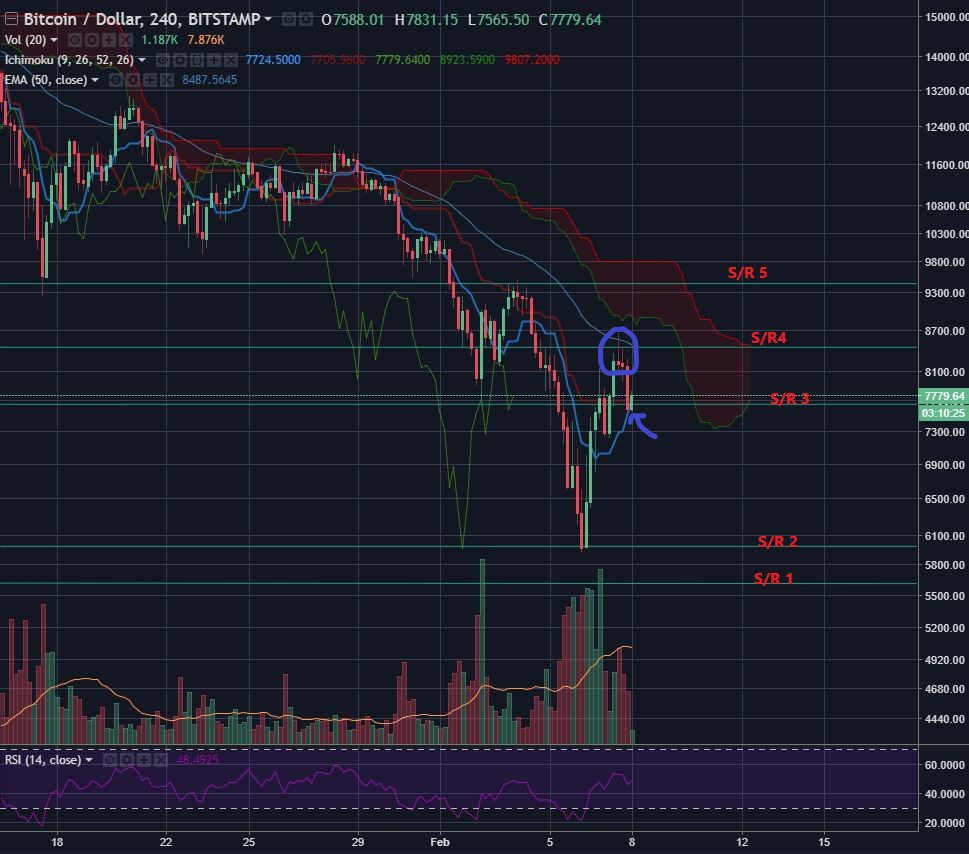
Note that I have added one more S/R @ 6000 to my list of key S/R zones.
$9450 "S/R 5"
$8400 "S/R 4"
$7600 "S/R 3"
$6000 "S/R 2"
$5500 "S/R 1"
Simply put, I'm using these S/R zones as part of plan to accumulate BTC and ETH for the long term. As my goal is to accumulate these at a discount. If it comes to a market crash then I will switch gears and make necessary arrangements to sell a portion of my crypto assets and wait for another entry. If it comes to a market pump then I will do the same but take some profits.
With that said, my plan of action at the moment is to look for breakthroughs and dips to key S/R lines when price action is going up. Or look for retests and bounces of S/Rs when price action is going down.
So, let's dive into today's movements.
We broke through S/R 3 and tested S/R 4 and then formed a shooting star (bearish reversal) just at S/R 4 and had the confirmation bearish candlestick thereafter - see blue circle. Now, we've come down and are testing S/R 3 and the red Kijun line - see blue arrow. If I see a good bullish confirmation (like a green maribozu - green candle with no wick, just body) then I will look to enter another BTC and/or ETH position. I want to enter in lower though, so it's not going to be a large portion of my fiat. If I enter in this trade, since it's higher than I want to be entering in on, I will be taking a bit of profit if price action hits my higher S/R lines.
Here's the 4HR to see what I'm talking about.
Here's the Daily for the full picture.
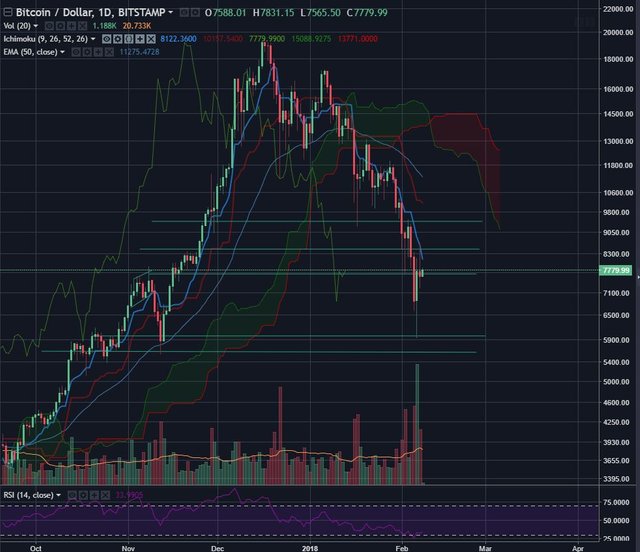
Update to this update I said this last post. But, if we break the Kijun line on the way down, since we are downtrending, that is a bearish continuation indicator for me. I will be looking to enter some fiat into this market when we hit the S/R 2 or 1.
Upvoted ☝ Have a great day!