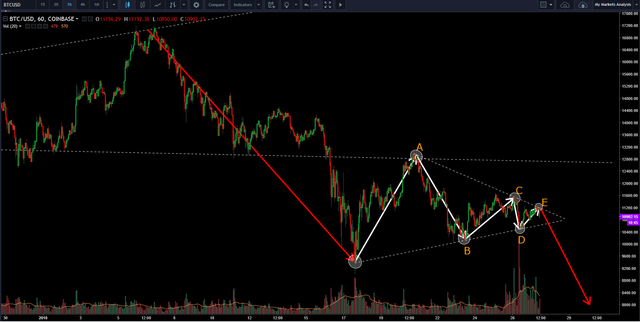
TEXTBOOK Symmetrical Triangle On BTCUSD!
Hey guys, as I have said in earlier posts I still believe another down movement of fairly big proportions is coming and some people think the CME Bitcoin Futures Contract for January settling on the 31st is a non-event, and we all have our opinions. I personally believe that in an unregulated market manipulation is not only possible but inevitable.
Anyway, in the image below I have illustrated how the pattern which has more or less fully formed on the BTCUSD Coinbase chart is a textbook example of a Symmetrical Triangle. This is a continuation pattern and therefore even if you do not believe Futures Traders are manipulating the market, this is a clear as day Bearish Continuation Pattern:

Quite frankly if we do not see a break out of the triangle to the down side I will be astonished.
Let me know what you guys think as I always enjoy reading your comments on the matter! Thanks for reading.

Legal Disclaimer: Remember this is just my analysis and not to be taken as professional financial advice. Do your own research beyond what you read in my blog posts and make your own decisions based on your beliefs about what to invest your money in.
hola! I like your post! Thanks for it! I went to jail because of cryptos... lets make steemit together to a better place with our content! I would like to read a bit more about you and maybe do you have some more pictures? I also just wrote a introduce yourself. Maybe you upvote me and follow me swell as I do? https://busy.org/introduceyourself/@mykarma/1-jail-review-bitcoins-3-years-ago
Great post again as usual. I definitely agree that we have yet to see the bottom (in this case, a double bottom). Futures have been manipulating the market for sure, but think about the new CME futures coming up the end of this month, and I see a lot of potential for an strong uptrend this time. All the panic sellers are out of the market, and once we have that strong dip, I don't see anything but a strong bullish market. Keep the great posts.
There are several patterns/triangles, It is a tough one and can go either way, down more probable than up... But we must understand manipulation does not always result in a take down. Good Post
Im sorry what event is that on that date?. Im looking at the cme group expiration calendar and the Futures last trade was yesterday the 26th of Jan. Theres another one coming after that on Feb 23rd . Heres the link. to their calendar of events. Or is this some other event? http://www.cmegroup.com/tools-information/calendars/expiration-calendar/ if you check Bitcoin went up today. Normal since the contract expired right?
Are you astonished yet? @investingtips
This should be a reminder that analysis is not a guaranteed predictor of future events. I'm not saying a move down is impossible, but by your chart price should not have moved above the 11k area. Instead we are (as of this moment) sitting at around 11.4 on coinbase and 11.9 on bitfinex.
Yeah, staring at this triangle for some time now. Crypto's amazed me more than once so I can't be sure how it'll play out, but I agree with You, it seems very clear that price should go down now.
But... if we assume BTC is following big bull flag type of correction, look at how incredibly similar are wave B and ongoing D. I marked sections to compare. The big triangle in wave B broke up - yes, it was different, looks like ABC, but still, the similarity is uncanny.
I think, after all, this bull flag could play out. I guess we'll see quite soon. A lot depends on the direction of incoming break out.
I'd appreciate if You share Your view on this.
https://www.tradingview.com/x/H0iPNlLm/
Still to early to rule out a bull trap, Can you see an ascending channel formed? Usually these channels result in a decent pull back. If the current candle hits 11,610 then pulls back there within a right triangle is formed.
Have pulled out 20% into cash in the hope it will fall to at least $9,000, If not I'm still holding 80%, either way HODL
Thx for Your reply. Sure, we can't rule out bull trap yet, but we're staying above the line for some time now. Looks like price will pull back a bit, but my bet is it'll rest on top of triangle and pounce decisively up.
I still think we'll end up pulling back to 7500-8500, maybe even a bit lower, but first we'll see approx 14500-15000. The big bull flag pattern in my chart forms in a very neat way. If it completes, it would be a perfect and healthy base for continuation of growth.
As for ascending channel - this correction started around half of December. We've seen quite a few ascending right channels since then. Most of them were followed by pullback, but most of them weren't deep. I personally don't treat this formation as a good indicator in crypto. I see it breaking up too often.
And ofc :-) First and foremost - HODL ;-) Personally I'm not in BTC, but since alts move most of the time in direct correlation to old papa Bitcoin, I'm very interested in its moves. We'll see how to goes - hoping for the best!
Well said szmyra, look at the 2 hour chart for the ascending channel from Jan 25, 3 days ago?
I know it is a relatively short time and most likely will take a small drop to say 10,500?
This remains within a small right bullish triangle and could shoot up any moment. current channel remains valid.
Not that easy since JPM and the central banks have gotten involved..
Good Luck