Long-Term Bitcoin Support BREACHED and Being Tested as Resistance! (UPDATED)

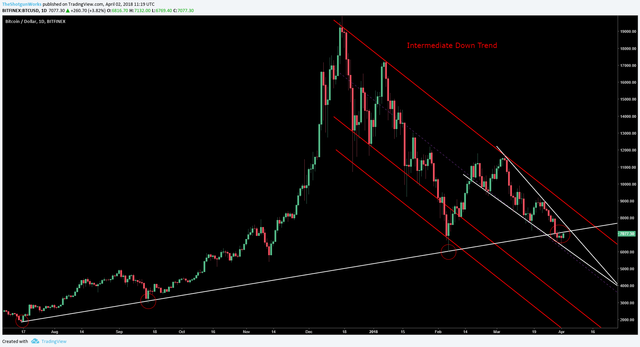
Hello guys so today I just wanted to point out that a long-term support line I drew a while ago has in fact been breached and price is now testing it as resistance now. Here it is:

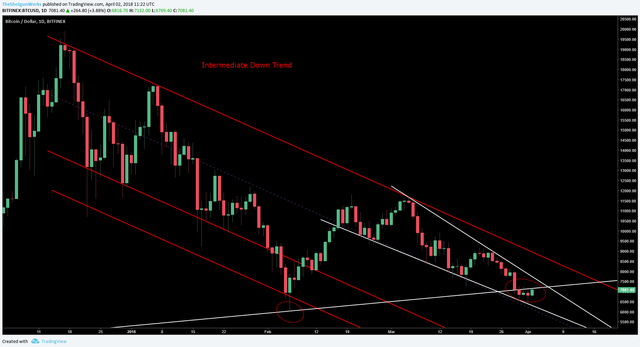
(More zoomed in view)

So if we breach this long-term trendline and go back above it I believe we could be in for at least a move up to the red upper trendline of the daily down trending channel that you can see on my charts. We have went down a lot recently (from 11.7k to 6.4k) and so a decent move up wouldn't be hugely surprising.
Of course if we, on the other hand, fail to breach this resistance line then I would expect price to at least hit $6,000 and maybe $5,500 while still staying in what looks to be a falling wedge (shown by the two falling white trendlines on the above charts).
Thank you for reading and I hope you have a great day :)
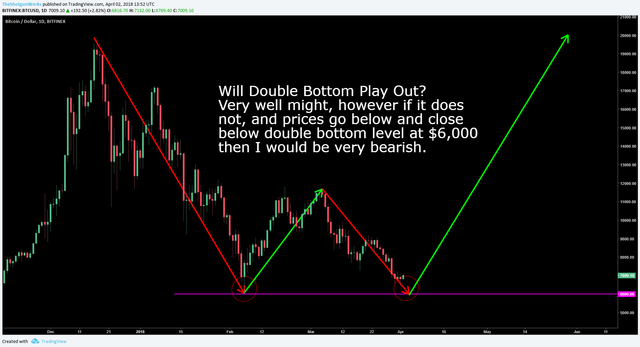
Update: Will Daily Double Bottom play out?:

Legal Disclaimer: This is just my analysis and not to be taken as professional financial advice. Do your own research beyond what you read in my blog posts and make your own decisions based on your beliefs about what to invest your money in.
