Big Money Accumulation and Distribution Tutorial! (Plus Bitcoin Long-Term Support Held)

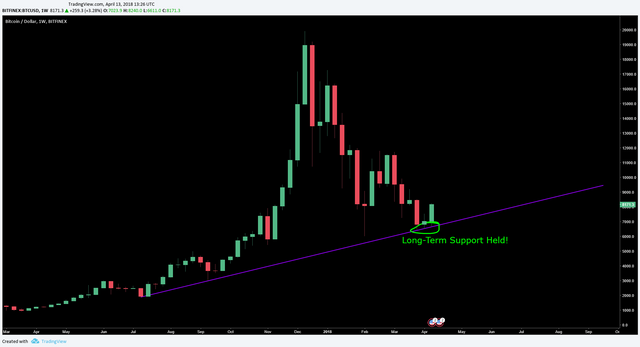
Hello guys, so as you can see in the following image Bitcoin held this long term support area and bounced upwards off it this week. I am no longer expecting $6,000 because of this as well as other reasons...

I am more bullish now because not only did price just hold that support line, but it bounced strongly upwards from it. I actually DON'T expect this to be another bull trap because of the following:

So did we see the true bottom for Bitcoin for the longer term? It is certainly very possible.
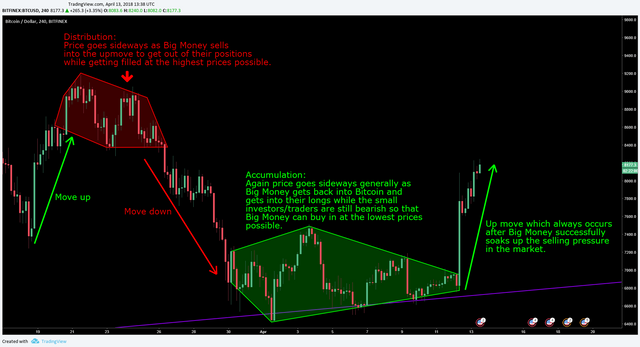
One other thing I want to mention relates to the above image about the accumulation and distribution carried out by Big Money/ Institutional Traders. If you think about it, when Big Money buys up all of the Bitcoin that smaller investors are selling, this puts a lot of the Bitcoin into "strong hands" (investors/traders who will not panic sell, you can count on them holding until they can sell at much higher prices) and with less Bitcoin in circulation, just a small amount of demand can put the price up a lot. I think this is why we seen such a massive rise recently as quickly as we did, from $6,800 to $8,200.
Now how high we go in the near future depends on what price Big Money wants to distribute at, so we need to look out for distribution forming and if we can find that then we can tell roughly where Bitcoin will top out, at least temporarily.
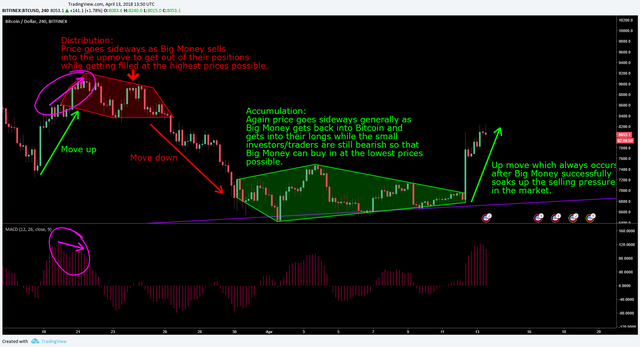
As shown above, distribution is prolonged movement that is overall sideways and it occurs after a strong move up. One technique to figure out if it is distribution or not is to look at whether the momentum of the immediately preceding up move is dying out or not. If it is then we can say that the up move is probably about to be over and distribution occurring now would make sense. The image below shows (on the left) that this signal occurred for the above Bitcoin distribution:

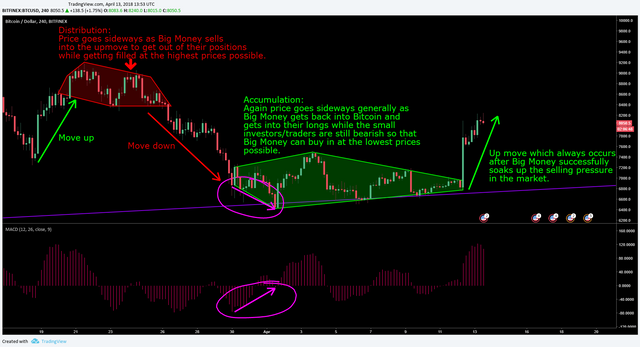
To find out whether a sideways pattern is accumulation you can do the same to see if the immediately preceding down trend is near its end, as shown below:

So in conclusion, if you are a HODLer, then you can be a little more happy with where price is going, if you are a trader with no bias, then you can wait and try to spot distribution occuring and sell before price is marked down again.
Thank you for reading and have a wonderful day :)
Legal Disclaimer: This is just my analysis and not to be taken as professional financial advice. Do your own research beyond what you read in my blog posts and make your own decisions based on your beliefs about what to invest your money in.

I think I have to agree that we won't be seeing 6000 now. Even when 17 April comes (tax D-day) we might see a dip but it won't be probably as low as previously expected.
My view of market is more like a moody woman. Now her moods is swinging upwards and sentiments are bullish. I can almost smell the FOMO fever coming on. I won't be breaking out the party stuff just yet but if the party does come then I am already at the venue for the celebration.
Yes I agree, and nice analogy :P
Thanks ;-)
Usually, a big jump is followed by a decline. I'm looking to buy the dips. I think that would be a smarter move, since I wasn't prepared for the big jump. I was hoping it would fall to $6000. Since it didn't, I will have to pounce on the next fall.
https://www.youtube.com/paulbegley34