Statistical Analysis of the price of bitcoin and the price of gold.
The price of bitcoin and the price of gold.
How does the price of bitcoin influence the price of gold, which has traditionally been considered the ultimate hedge or ‘risk free’ asset. Some people are claiming that the wildly speculative and risky bitcoin market is the ‘Digital Gold’. How accurate are their claims on a purely statistical basis? My hypotheses is that the bitcoin is much more volatile in terms of its standard deviation from the mean price and there will be little positive correlation in terms of price. The standard deviation, mean, and correlation will be useful tools in to aid in answering this question.
The data was collected from the charting website tradingview.com, which hosts the price history of many assets of many different exchanges. Specifically the exchange rate of bitcoin to dollars was from the Bitfinex exchange. Bitfinex is the most popular bitcoin exchange measured by volume of bitcoins traded. Prices were collected from the first of every month for the past 13 months starting on the first of january 2017. Gold prices were collected from the SPDR Gold Shares ETF, GLD, which is a fund designed to reflect the performance of the price of gold bullion. These prices are also found on tradingview.com and were taken from the first trading day of every month. The GLD trades on the NYSE Arca which is only open on weekdays while Bitfinex trades bitcoin 24/7.
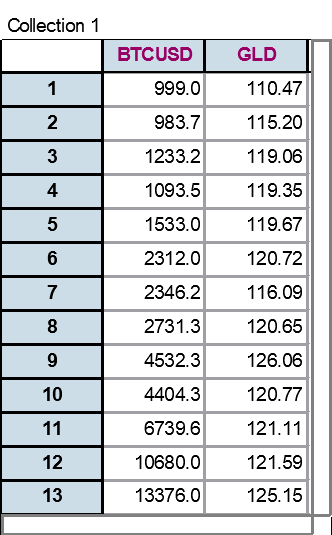
Here is a table showing the raw data with the price of BTC/USD and GLD for each of the 13 months. Month 13 is January 1st 2018.
The next chart showcases the the GLD price and its correlation with the price of Bitcoin.
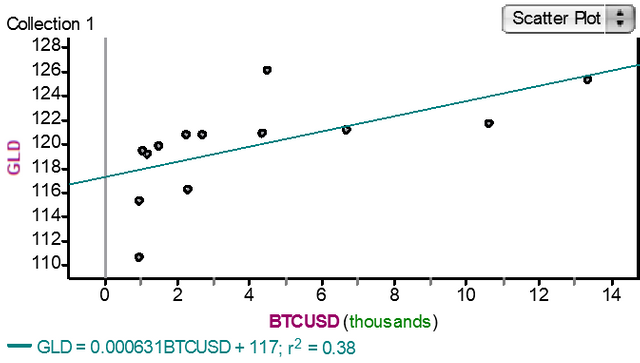
As seen by the least mean squares line, there is a positive correlation and slope. Indicating at least some sort of pattern. This could be a result of the dollar falling because gold has traditionally been the inverse of the value of the dollar. The R squared value of 0.38 shows that the correlation is slightly positive.
The next two graphs highlight the difference between the stability each assets prices.
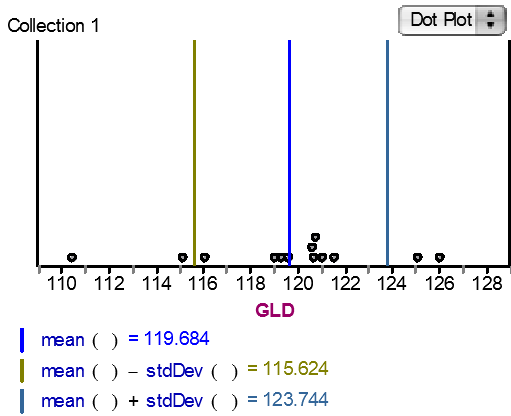
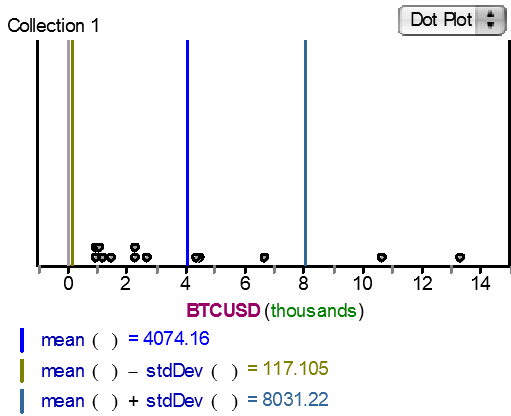
As seen in the dot plot of the prices of GLD over the past 13 months the mean is 119.684 and with BTCUSD the mean is 4074. GLD is basically symmetrical there is only one value that makes it a bit skewed to the left but it is not extreme.
On the other hand the dot plot for BTCUSD is extremely skewed to the right. This means we should look at another chart with the median and quartiles plotted.
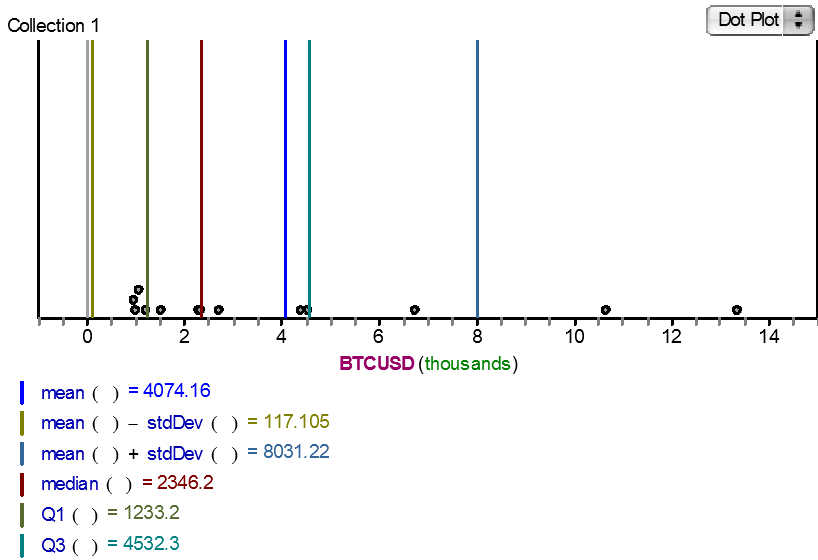
The Median is a much better tool for finding the center of BTCUSD. While the mean is pulled up to $4074.16 the median is only $2346.2. Thats a difference of $1727.96. This highlights how easily mean can be pulled by a skewed data set. Considering the severity of the skew it is also best to use the IQR and the quartiles on the dot plot of BTCUSD instead of the standard deviation.
Below is a summary table with the mean, standard deviation, min, Q1, median, Q3, max, and the IQR for both BTCUSD and GLD.
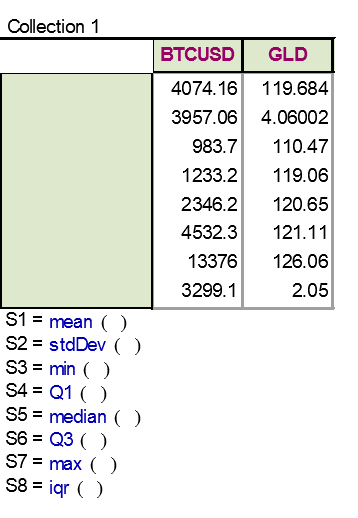
The stdDev is the first statistic that should really jump out. For BTCUSD it is 3957.06, nearly as large as the mean price of BTCUSD (4074.16), while the stdDev of GLD is only 4.06 with a mean price of 119.684. This shows how wild the fluctuations in the price of bitcoin are compared to the fluctuations of price of GLD. And this is just getting price on the first day of every month. The volatility within the month for btcusd is even wilder as shown by these charts.
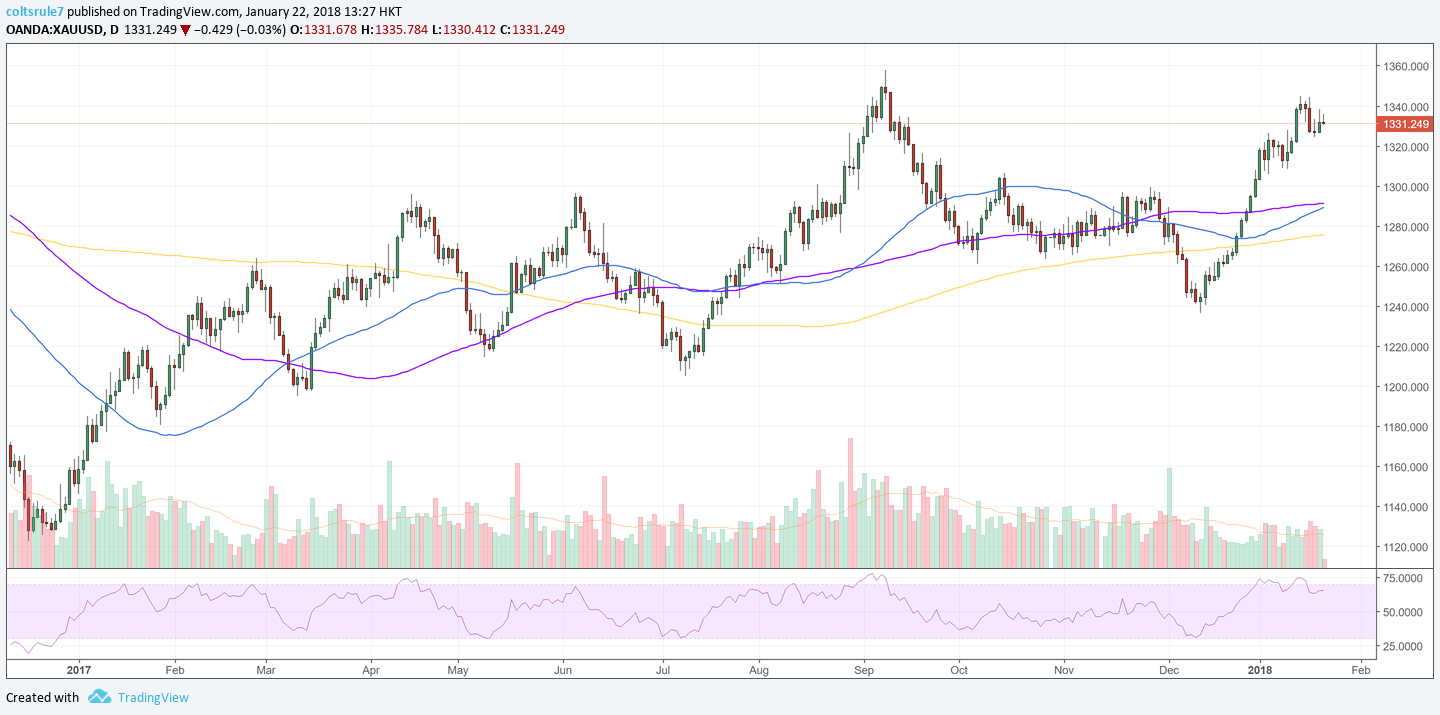
GLD’s 1 year chart. Showing time on the x axis and price on the Y axis (on the right)
And
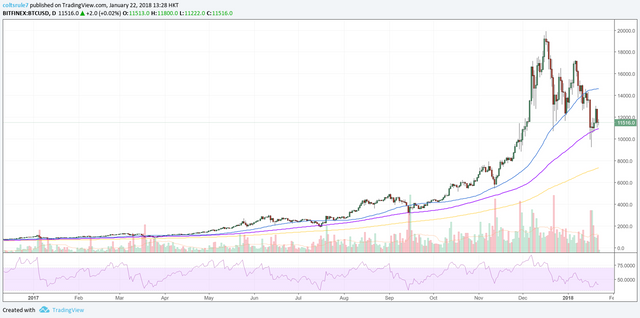
Bitcoin’s 1 year chart. Showing time on the X-Axis and price on the Y-Axis (on the right).
The value of $999 is barely even visible.
The claim that some have made saying that “Bitcoin is digital gold”, at least according to the statistics, is completely false. While it is true that as bitcoin rises gold has shown some correlation and has risen too that is just about the extent of the similarity. With a massively skewed to the right distribution of the price of bitcoin and a IQR of 3299.1 compared to the slightly left skewed distribution of the price of GLD and a IQR of just 2.05 it is undeniable that Bitcoin is much much more of a risky asset than GLD. Purely on the range of price action month to month that is. One way this study could be improved is by using more data points from the past 13 months. Expanding the monthly data collection to a weekly collection would give a higher resolution of the figures. It would also most likely make the IQR of bitcoin even larger, due to the intra week swings. The direct relationship Bitcoin and Gold have to each other is not really clear from this study. The positive correlation is only a very small part of the story. And even that could be explained by the one thing that the two assets have in common. They are both traded against the US Dollar. The correlation could be evident only because the dollar is depreciating and therefore both being seen as a hedge against inflation are being rewarded. Both have a fixed supply while the dollar has a possible infinite supply. Adding the dollar into the study would have probably yielded more interesting results.