Ichimoku Cloud: What is it and How do I use it ?

This is the third article of ICODOG’s latest series, “Trading cryptocurrencies successfully”, which focuses on the main investment strategies to trade the latest sensation in the world’s asset market, cryptocurrencies.
The previous article introduced the technical indicators available in the market and caution on how and when to use these indicators. This article focuses on the Ichimoku cloud as the first technical indicator to be expounded on the series.
Ichimoku cloud is a technical indicator that uses the support and resistance techniques to make future predictions of trends. Using the past period highest and lowest price averages, the indicator forms a cloud that predicts the future support and resistance levels.
The Ichimoku cloud consists of five major calculations namely; conversion line, base line, Lead 1, Lead 2 and the Lagging span line.

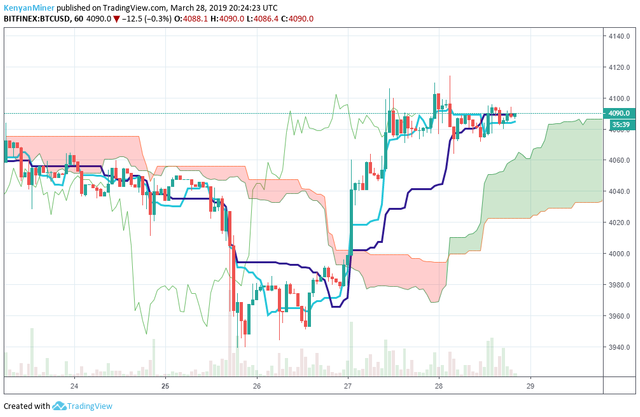
Ichimoku Cloud indicator on the BTC/USD pairing. The five data points makes it look messy.
Outline
- Calculating the Ichimoku Cloud averages
- The key five lines of the Ichimoku Cloud
- How to calculate
- Interpreting the Ichimoku Cloud
- Limitations of using the Ichimoku Cloud indicator
- Conclusion
Calculating the Ichimoku cloud averages
The key five lines of the Ichimoku Cloud
As mentioned before, the Ichimoku cloud is a combination of five lines, four of which are calculated using past averages of price of the asset. The five calculations include the:
- Conversion Line, also known as kekan sen, the average of the highest and lowest prices in the past 9-periods.
- Base Line, also known as kijun sen, the average of the highest and lowest prices in the past 26 periods.
- Lead 1, also known as the senkou span 1, the average between the conversion line and the baseline
- Lead 2, also known as senkou span 2, is the average of the highest and lowest prices in the past 52 periods.
- Lagging span line, also known as chikou span, The close price plotted in the past (usually 26 periods). This setting can be changed to fit custom preferences.
How to calculate
The trading platforms available for traders in today’s markets will plot the cloud on the charts automatically by selecting the indicator. The cloud is plotted using midpoints between the highest and lowest price points in the past. While it is pretty much outdated to calculate the Ichimoku cloud by hand here is how you can do it. Follow the steps below to create one data point;
- Calculate the Conversion and Baseline values.
- Calculate the Lead 1 based on values from (1) and plot the values 26 periods into the future.
- Calculate the Lead 2 and plot the data 26 periods in the future too.
- The difference between the two Leads creates the cloud. If Lead 1 crosses above Lead 2 then the cloud is colored green and if Lead 1 crosses below Lead 2 the cloud is colored red.
- Finally, plot the Lagging span line using the closing price as data points 26 periods in the past.
Repeat the process and connect the data points placed to complete the Ichimoku cloud.
The above steps will create one data point. To create the lines, as each period comes to an end go through the steps again to create new data points for that period. Connect the data points to each other to create the lines and cloudy appearance.
Interpreting the Ichimoku Cloud
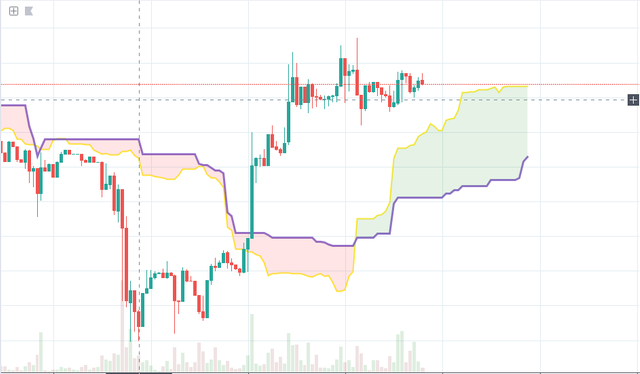
The Ichimoku cloud is quite messy if all the five lines are plotted on to the chart. To make the chart cleaner and more understandable, trading platforms provides an option to select which lines to keep on the chart. Remember the Lead 1 and Lead 2 lines to form up the cloud hence cannot be unselected. Check the chart below with only the Lead 1 and Lead 2 data points plotted.

Chart showing the Lead 1 (yellow) line and Lead 2 (purple) line
The Ichimoku cloud is not hard to interpret as much as it is to plot hence the huge adoption of the indicator for traders building a strategy. When the price is above the cloud, the trend is rising and when the price crosses below the cloud, a selling momentum is in play. Any price movement between the clouds signals indecision in the market or a transformative period.
The Lead spans also help confirm the trend movements such as when Lead 1 crosses above Lead 2 then a bullish trend is ensuing and a cross below Lead 2 signaling a bearish trend.
The Ichimoku cloud also plots future support and resistance levels, unlike other indicators that only allow plotting of the current and past support and resistance levels. Traders will often use the Cloud as an area of support and resistance depending on the relative location of the price.

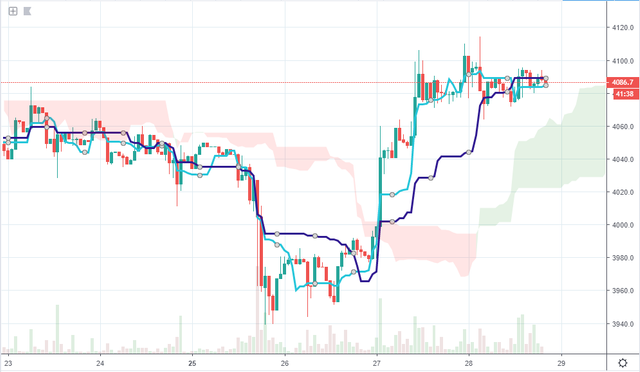
Chart showing the plotting of the conversion line (Light blue) and Baseline (purple)
Furthermore, the chart provides an indicator using crossovers between the conversion line and the baseline. When the price is above the cloud, check for a crossover of the conversion line over the baseline which offers a buy entry point. A crossover of the conversion line below the baseline offers a chance to close your trade.
Limitations of using the Ichimoku Cloud indicator
The chart looks busy. Once again, the plotted Ichimoku cloud with the five lines will be difficult for most investors to follow. Platforms provide an option to select the lines required at the moment.
As is with most indicators, the data points are based on previous historical data which may not be predictive of the future returns.
The cloud itself remains above or below the price line for a long period of time which makes it irrelevant for short term trades.
Conclusion
The Ichimoku Cloud presents one of the best indicators to use. While it can be difficult to get the hang of it, the indicator provides better results than most technical indicators. Remember to combine the indicator with others to avoid falling into a trap in case the cloud gives a false signal.


