Cryptocurrency Technical Indicators: Renko Charts

This is the fourth article of ICODOG’s latest series, “Trading cryptocurrencies successfully”, which focuses on the main investment strategies to trade the latest sensation in the world’s asset market, cryptocurrencies. The previous article introduced the Ichimoku cloud, what it is and how to use it. In this article, we focus on Renko charts and the significance of the indicator in cryptocurrency trading.
You’re probably used to candlesticks and equally spaced timelines on charts to make technical analysis and predictions of future cryptocurrency price. A Renko chart is a unique type of technical indicator that offers the users a signal in price movements. Unlike the normal charts, Renko charts have equivocal timelines and are built using “bricks” that depend on the fluctuations in price rather than candlesticks. The chart is used to determine the support and resistance levels, reversals in price and price movements in the future.

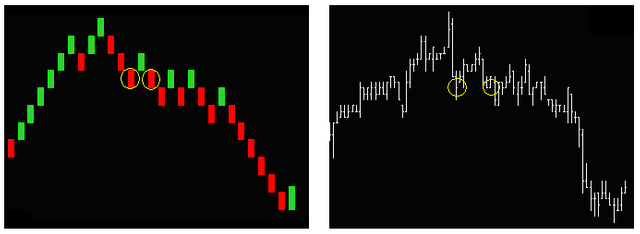
Comparison between a Renko Chart and a bar chart
The Renko chart is said to be named after the Japanese word for bricks, “renga” following that the chart is built of ‘bricks’. The concept of the chart is really simple as the user picks a “brick size” and price movements crossing the “brick size” form the next brick.
Outline
- Constructing a Renko Chart Brick
- Types of bricks
- Illustration
- How to calculate a Renko Chart
- The Average True Range (ATR)
- The Traditional method
- Limitations of the Renko chart
- Constructing a Renko Chart Brick
As mentioned earlier, a Renko chart is a unique chart that follows price movements rather than the real-time price changes. The chart is designed to filter out the minor movements in the price of an asset -in this instance cryptocurrencies. Renko charts offer the users with clear trends using the support resistance indicators and reversal patterns. However, the charts are disadvantaged as leaving out the minor trends leads to loss of information on the market. The charts are also very unpredictable, meaning a brick may take either months or minutes to construct.

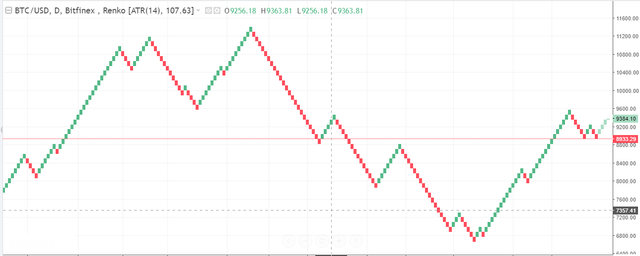
Example of a Renko Chart (Image; Investing.com)
Types of bricks
Renko chart bricks are of various types that signal different actions of trading to take by the investors and traders. The chart has 4 major brick types namely;
- Up brick
- Down brick
- Projection Up brick
- Projection down brick
Illustration
Renko chart is one of the easiest indicators used to make technical predictions in the market today. The first step is the user selecting a brick size. For example, let’s assume the brick size selected is $3 whereby a cross below the current brick price, below or above, will create a new brick.
We further assume that the current price of the cryptocurrency is $100 USD. If the price moves up to $103 USD, a new up brick is formed on the chart. It’s key to note that the bar will only be drawn on the chart if the price hits the brick size, not $102.99 or any number below the stipulated mark. This also happens if the price of the coin drops below $97 USD whereby a down brick will be drawn on the chart. Again, the brick will only be drawn once the order is filled and not before.
Furthermore, the bricks are immutable in that once drawn on the chart, the action will not be undone but rather move on to the next brick. For example, if the price hits $106 USD, the chart will draw a brick ending at $103 and a second one at $106 USD. This also applies during a downtrend where the price of the cryptocurrency drops below $103 USD mark after reaching it. A brick will be drawn on the chart, and a down brick will not start until the price hits below $100 USD.
Renko charts has two major points to note before using the indicator:
- The bricks must touch at a 45 degrees angle and their corners will always be touching.
- Only one brick per vertical column.
How to calculate a Renko Chart
Renko Charts are calculated using two methods namely the Traditional method and ATR method.
The Average True Range (ATR)
Uses the values generated by the Average True Range (ATR) indicator. The ATR is used to filter out the normal noise or volatility of a financial instrument. The ATR method “automatically” determines a good brick size. It calculates what the ATR value would be in a regular candlestick chart and then makes this value the brick size.
The Traditional method
Uses a user-pre-defined absolute value for brick size. New bricks are only created when price movement is at least as large as the pre-determined brick size. The upside to this method is that it is very straightforward and it is easy to anticipate when and where new bricks will form. The downside is that selecting the correct brick size for a specific instrument will take some experimentation. Typically, you will want to select a brick size that is about 1/20th of the current value of the instrument.
(This section is from TradingView)
Limitations of the Renko chart
The loss of information by ignoring minor trends. The charts do not show detailed information when the price is ranging, which could be useful for a trader.
The charts use the closing price to form the decision which leaves out a huge range between the highest price and lowest price difference.
As is with any other cryptocurrency technical indicator, the Renko charts are not 100% sure and the use of other indicators is needed to confirm the trade position to take.


