BTCUSD analysis: Searching for Investors
Analysis of Bitcoin trend and the most likely scenario for the Bitcoin price movements in the near future
In this post I applied the following tools: fundamental analysis, all-round market view, market balance level, volume profile, graphic analysis, trendline analysis.
Dear friends,
Welcome to my series of cryptocurrency price predictions. Another week is over, and so, it is time to update Bitcoin forecast, going on BTCUSD analysis, and to update BTC trading scenario for the near future.
If we compare the previous Bitcoin forecast with the actual situation, it will be like this:
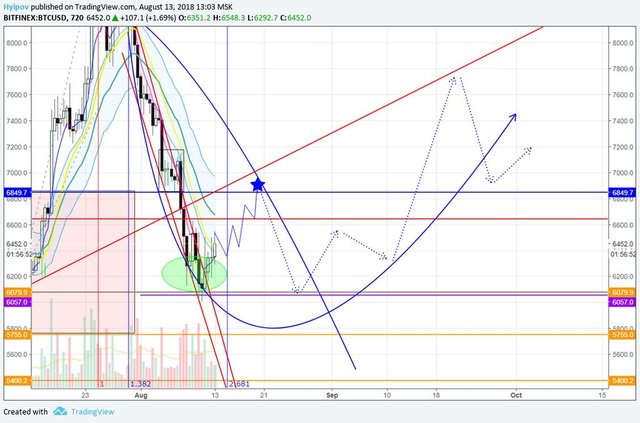
(bitcoin forecast)
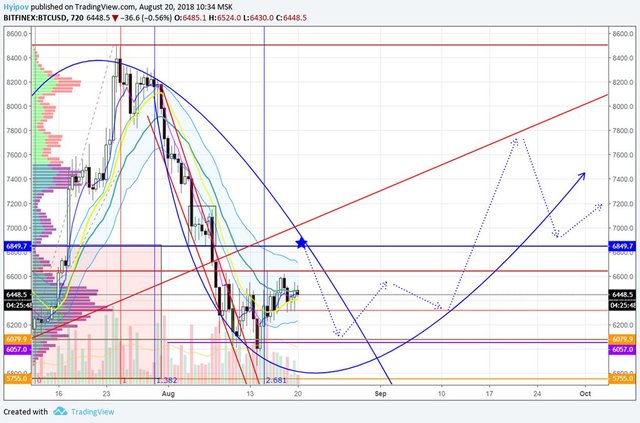
(actual situation on 20.08.2018)
As you see, the general ticker direction matched to my previous BTCUSD forecast, but the price hasn’t reached the target at 6850 USD.
To figure out, whether it will grow higher, I suggest we carry out all-round analysis for BTCUSD.
But, first, let’s study the events of last week. In fact, there weren’t any fundamental events but for one interesting fact.
It is the issuance of exchange-traded notes (ETN) by XBT Provider. The new assets will be traded on NASDAQ OMX Nordic with the ticker of CXBTF.
It would seem to be a lucky chance for the U.S. institutional investors. Now, everybody can legally invest into cryptocurrency, without any worries about regulator’s sanctions.
However, the market hardly responded to this event. It seems as if nothing had happened. Experts, of course, explained it by the fact that an ETN is not an ETF.
It is really so! ETF is an exchange-traded fund. When you buy an ETF, you buy a share in the fund that really owns this asset. ETN is an exchange-traded note, or, in other words, a promissory note or a bond, which is a company’s promise to buy this note at the market price of the underlying asset. The main feature of this instrument is that the ETN issuing company is not obliged to keep the funds raised in the underlying asset, that is, in the given case, in bitcoins; and so, in case of the company’s bankruptcy, you are not guaranteed to get real bitcoins in exchange for your CXBTFs.
Therefore, the investment risk, associated with those notes, is much higher. Moreover, there have been ETNs for Bitcoin since 2015, which are sold for euro or the Swedish krona. It means that institutional investors and other wales have, in fact, had the opportunity to LEGALLY enter the cryptocurrency market since 2015.
This fact is the further evidence that the influence of institutional investors on the cryptocurrency rates is overestimated, as well as the influence of ETFs.
Of course, everybody judges by the gold market, and the ETF influence on it. But you shouldn’t forget that gold is a commodity, an exhaustible natural resource that nobody can hack or launch a 51% attack. Gold doesn’t involve the risk that another natural resource will appear and leave it behind, in terms of technologies, and will take its popularity; gold doesn’t involve the risk that another hardfork will become more appealing than original gold; gold doesn’t involve the risk that the next update will result in a critical flaw, able to block all payments...this list can be continued for a long time, I think, you got the message????
I, in no way, call for giving up on the idea that ETF will help Bitcoin to grow in price, I rather ask you to look at the situation in a more sensible way and interpret it more critically.
https://hyipi.com/wp-content/uploads/2018/08/na-nedelnom-grafike-BTCUSD-my-vidim-dostatochno-pozitivnuju.jpg
According to Bitcoin technical analysis, in the 1-week BTCUSD price chart, there is a quite positive white candlestick that looks like almost a bullish hammer. It is only for its tail that is too long for this pattern.
Nevertheless, I have every reason to expect a fractal, like that in late June, to develop.
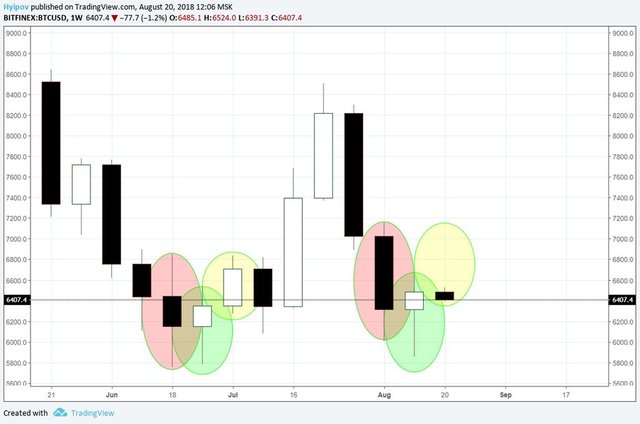
As you see from the Bitcoin price chart above, the upward movement to 7200, according to the pattern, would be quit natural and adequate.
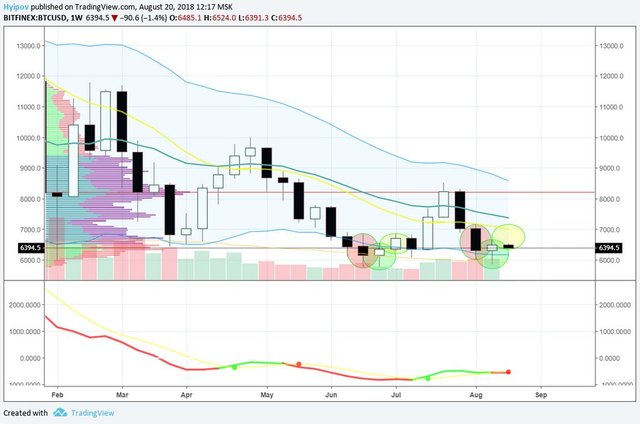
MACD in the weekly chart can also influence the current Bitcoin to the U.S. dollar price trend. It is showing the red light at the level of about 6400. To turn this signal into green, the ticker must go outside the current channel, up to the level around 7200 and close the weekly bar there.
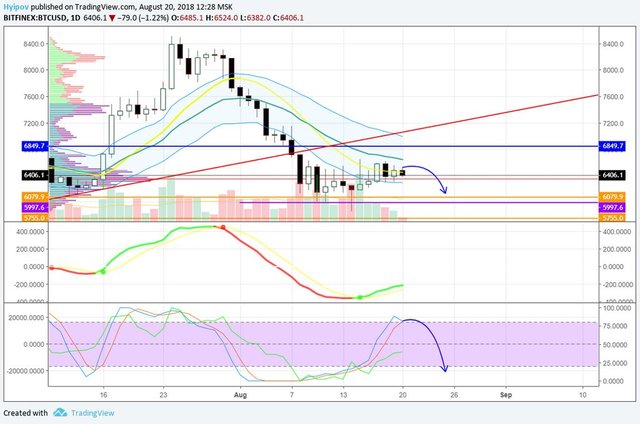
In the one-day timeframe, the situation also looks rather bearish. You see, the ticker can’t break through the daily line of Keltner channel at 6640 USD, and RSI stochastic is painting a rounding and the bearish meeting of moving averages at the top of the window. This situation suggests a correction with the retest of the current support levels at about 6000 USD– 5800 USD.
It can well turn out that bulls won’t give up without a fight and there will be pattern, similar to that in late June.
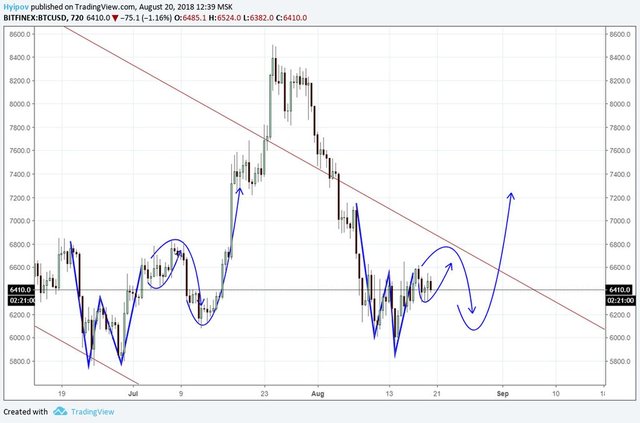
In the BTCUSD price chart above, I marked it with blue arrows. According to it, the price should rise up to around 6800, where from it may drop down to 6000 USD. The price, under such conditions, can grow only after the retest of the low at around 6000 USD -5800 USD.
Let’s analyze the Bitcoin charts, from the point of view of my big experiment in the cryptocurrency market, which I started just yesterday.
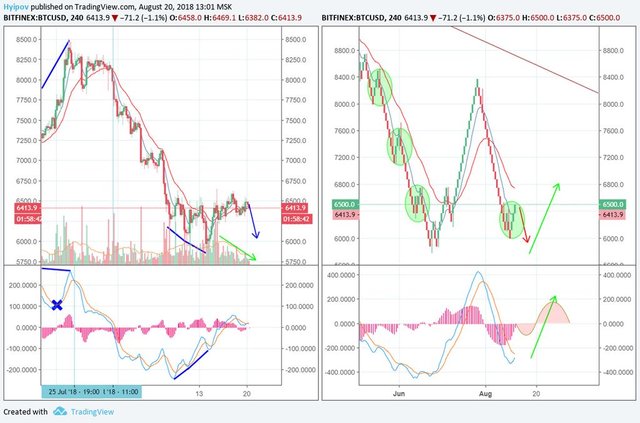
In the BTCUSD 4H timeframes of my experimental charts, there is a double bullish convergence in the candlestick chart; however, it is clear how difficult it is for the price to increase. In the volume profile indicator, there is systematic decline in the trading volume, which is a sign of buyers’ weakness. In addition, Renko suggests reversal signals, having painted three green boxes; however, this signal may be false. In the right chart, there is a similar pattern that ends up with a drop. To prove the bullish reversal, we need some evidence by MACD and at least another green box in the bullish Renko chain.
Summary:
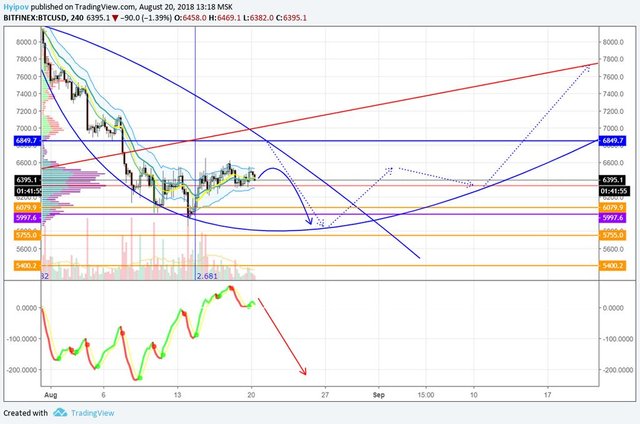
In general, I have every reason to expect Bitcoin price correction towards the support at around 5755 USD – 6000 USD in the near future. In the daily timeframe, Bitcoin is still trading down, and so, it won’t rise soon. However, there are no reasons for panic, as neither fundamental analysis nor technical one suggests any deep Bitcoin price drops. The feeling of bottom will support purchases and get people to enter trades at the current levels.
That is my BTCUSD trading scenario. Go on following the rate and staying informed. I wish my Bitcoin price predictions are useful for you!
I wish you good luck and good profits!
PS. If you agree with the forecast write “+” in the comments, if you don’t agree, put “-”. If you liked the post, just write thank you, and don’t forget to share the post. It is easy for you and I will be very pleased :)
Stay informed on the latest cryptocurrency news, follow my posts in the blog.
I wish you good luck and good profits!
Regards,
Mikhail @Hyipov by liteforex.com

good analysis. let's hope that it happens! continue such contributions. upvote