Bitcoin - Current Chart Situation till 1st of August
Hello investors and traders,
first of all, I want to say thank you to almost 150 followers today! Really appreciate it.
Coming to the topic, the chart of Bitcoin and what is possibly going to happen on 1st of August.
Im sure you heard about the upcoming fork in Bitcoin so i dont have to talk about that specificly again.
Here is what i see in the 2 hour chart in Bitcoin though:
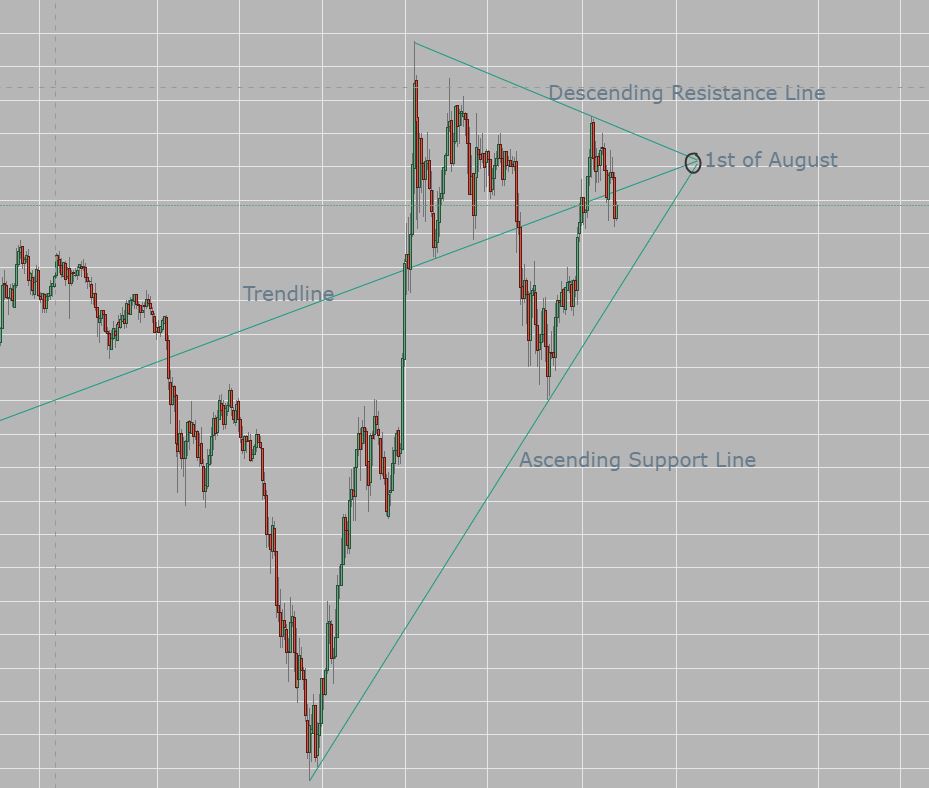
As you can see, exactly at the first of August there is the triangle ending between the descending resistance line and the ascending support line. The trendline also comes into the same point, which indicates that something will happen to the chart there.
As you may have heard already, it is likely that the price of Bitcoin will increase after the 1st of August, but it could also go down if something does not go through properly.
You cannot be sure in this situation. Anything can happen.
Lets hope for the best!
- Appreciate your upvotes and follows
- This is not investment advise