Alarming Cryptocurrency Statistics! 💫 Comes with 'Win' Rates for the past 7 years

Knowing what happens and when it happens will help any trader make a better informed decision. Below, you will see several statistics that wer derived from the Probability Tool Suite by https://traderbotmarketplace.com You can create your own statistics with ease by using this tool.
When Bitcoin has a DOWN DAY and then an UP day, the following day finishes UP 58.58% of the time.
1 = Down Day
2 = Up Day
3 = The Following Day (The 3rd Day is the signal Day) The third day is considered a 'WIN' if it finishes HIGHER than it opened.
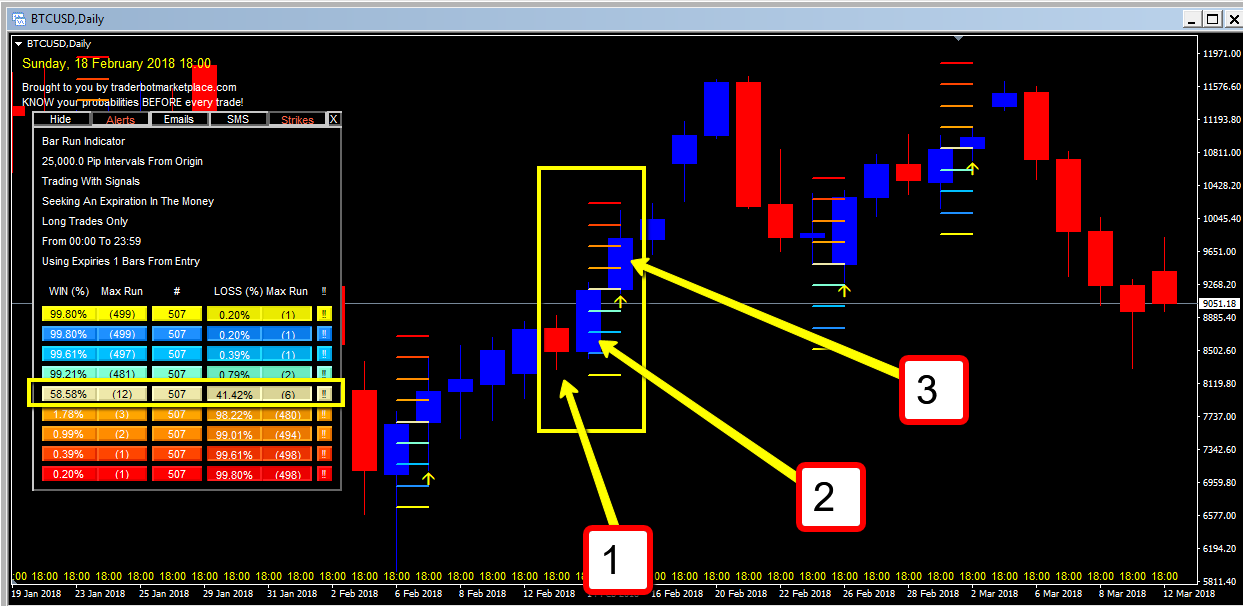
This is based upon the past 507 signals this pattern has generated since October 2011.
The '3rd day' or the day following a down day then an up day has finished up a maximum of 12 times in a row and has finished down 41.29% of the time for a total of 6 times in a row.
Daily Win Rate
When this pattern occurs on Mondays, it wins 61% of the time.
Tuesdays = 60%
Wednesdays = 59%
Thursdays = 53%
Fridays = 61%
Which Months Were Better? (Since 2011)
January
51 Signals
62% Win Rate
February
39 Signals
64% Win Rate
March
39 Signals
61% Win Rate
April
36 Signals
63% Win Rate
May
44 Signals
50% Win Rate
June
56% Win Rate
46 Signals
July
38% Win Rate ( Big Fat Loser Month!)
49 Signals
With months like July, you can take a vacation then! LOL
August
54% Win Rate
44 Signals
September
34 Signals
58% Win Rate
October
40 Signals
67% Win Rate
October was the best month.
November
46 Signals
63% Win Rate
December
43% Win Rate
62%
By analyzing the data, I now know that I DO NOT want to trade this signal in July.
All of the data was derived from the Probability Tool Suite by https://traderbotmarketplace.com You can create your own statistics with ease by using this tool.
More Random Statistics
After X days in a row, how often is the next day UP?
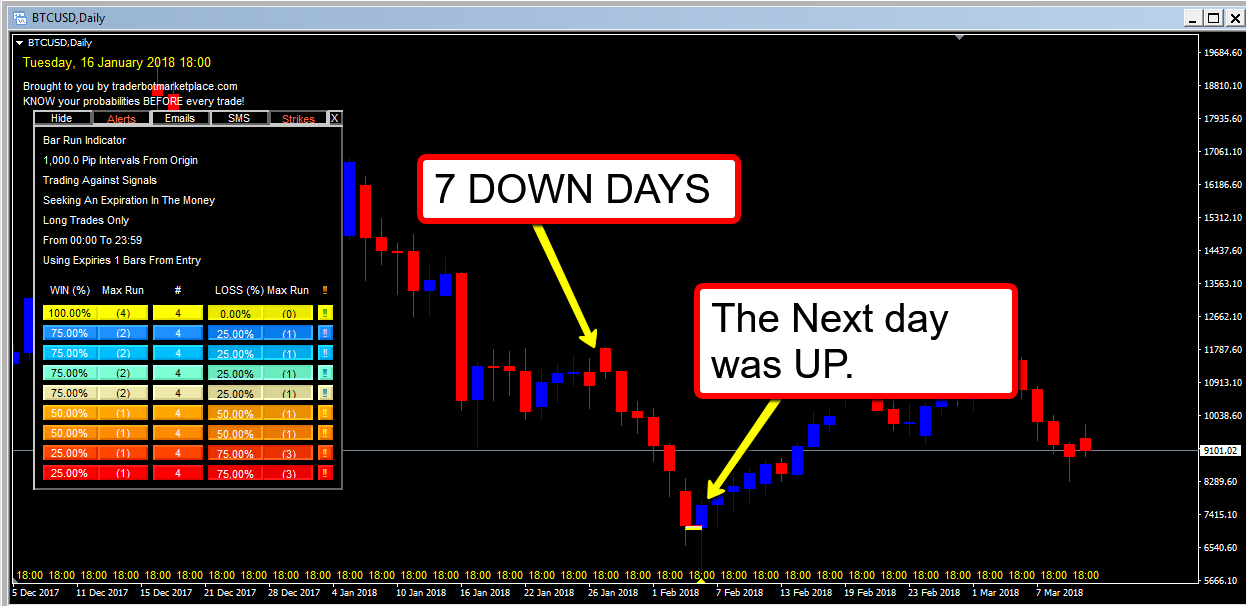
We call this a '7 Day Bar Run'. It has a win rate of 75% since 2011.
- After 6 DOWN days, the next day is UP 66% of the time. It's happened 12 times since 2011
- After 5 DOWN days, the next day is UP 58% of the time. It's happened 29 times since 2011
- After 4 DOWN days, the next day is UP 40% of the time. It's happened 49 times since 2011
- After 3 DOWN days, the next day is UP 50% of the time. It's happened 101 times since 2011
- After 2 DOWN days, the next day is UP 54% of the time. It's happened 222 times since 2011
- After 1 DOWN days, the next day is UP 55% of the time. It's happened 507 times since 2011
Some Lite Coin Weekly Statistics
A down week is followed by an up week only 45% of the time. This has happened 75 times since 2011.
2 down weeks are followed by an up week only 40% of the time. This has happened 27 times since 2011.
3 down weeks are followed by an up week only 40% of the time. This has happened 15 times since 2011.
4 down weeks are followed by an up week only 33% of the time. This has happened 9 times since 2011.
5 down weeks are followed by an up week only 50% of the time. This has happened 6 times since 2011.
6 down weeks are followed by an up week 66% of the time. This has happened 3 times since 2011.
7 down weeks are followed by an up week only 100% of the time but has only happened once since 2011.
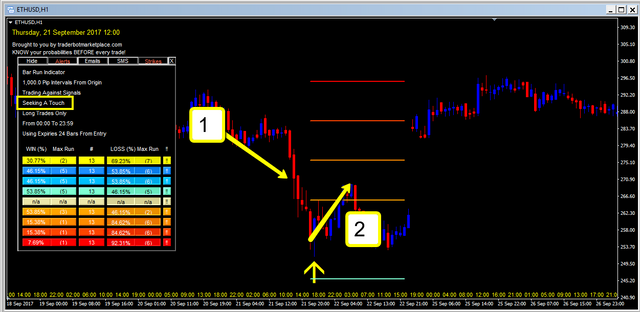
An Ethereum Statistic
7 Bar Run Hourly
Since , whenever price pulled by by 7 hourly bars, price rose by $10 over the next 24 hours 53% of the time. It also fell by $10 about 53% of the time. Price id not remain at the levels because we are looking for a 'touch' instead of an 'expiry'. In theory, a trader could put on a straddle (if there were a contract available).
1 = A 7 bar pullback
2 = Price rose by $10 on Ethereum over the next 24 hours
By the way, this works with Ripple, Dash, Monero, and many others that are available with the MT4 or MT5 trading platform.
AAAAllllrighty Rooo! I have had a blast putting this together for you guys. This article is meant to make you think, " What are statistics?" or " How can I use statistics in my own trading?"
- Would you like more of these types of articles?
- What statistics would you like to see next time?
Happy Trading!

Coins mentioned in post: