Two week analysis of Bitcoin
This is analysis of bitcoin for medium term traders. At time of writing this post it is $4237.
This post is helpful for bitcoin traders who trade bitcoin for medium term say 7 to 14 days.
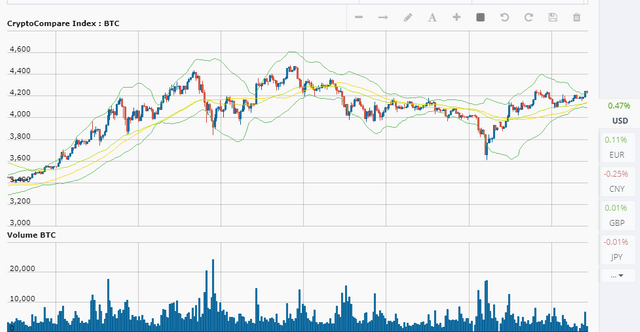
As you can see in the image graph is touching upper bollinger band.
Yellow denotes SMA50(Simple moving average)
Green Denotes EMA50(Exponential moving average)
As you can see SMA50 is just about to cross EMA50 that means selling is about to start.
Bollinger band is showing the same thing.
So my advice is that you should sell your bitcoin now.