I am not talking short term. Long term all your charts look bullish. And sometimes some corrections.
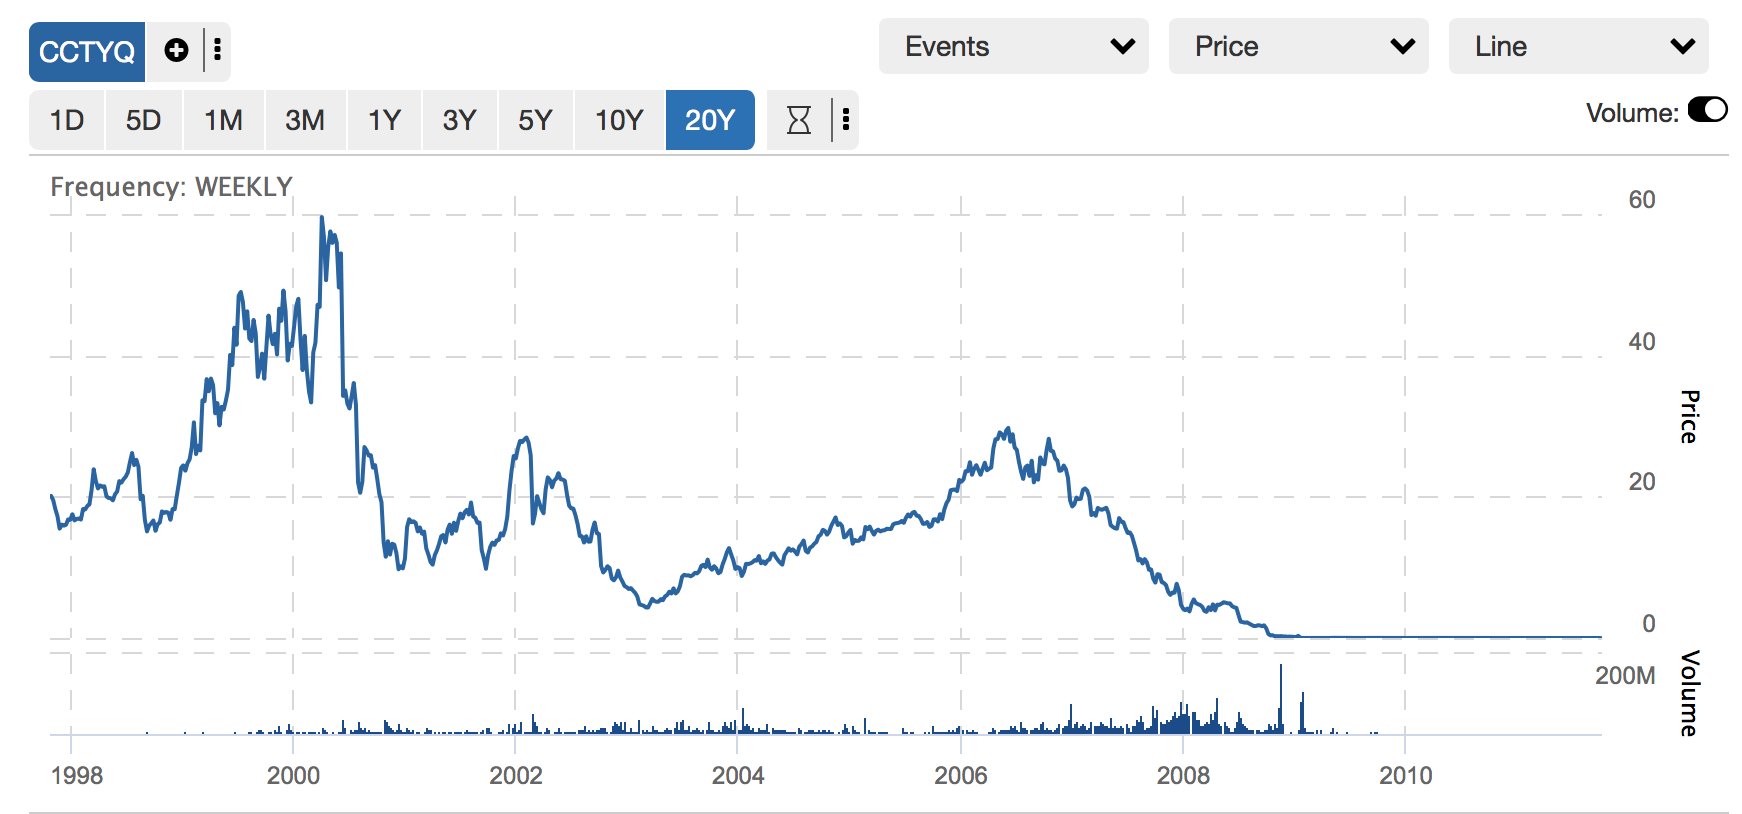
In your 15+ years as a TA you have encountered companies that went bankrupt, right? So the correction on their chart was the final correction. NO up-tread afterwards.
Can you show such a chart? Just TA. No fundamental analysis. Can you figure that out just from TA?
With a publicly traded company, quarterly disclosures generally drive the sentiment that's reflected in the stock chart. That would then drive a massive correction down to zero when the business fundamentals dictate failure of the company. A good example to look at would be Circuit City. They started talking about cost cutting measures in 2007 and eventually filled for bankruptcy in Nov of 2008. The thing that stands out to me is the correlation between sinking price with higher volumes from 2007 through the drop to near zero in Dec 2008.
With cryptos, you wouldn't see the same level of public disclosures. Once the rumor mill started talking about coin failure, you'd see a high level of panic and a compressed cycle of selling / price drop leading to zero.

They are bullish because he is recommending coins that will go UP (hence bullish)
Duh :-p
Great question. I've been wondering the same. I doubt if it's possible with pure TA. But I'm not the veteran here.