Yes, We Are In A Bubble... Here Is How To Know When To Sell Your Bitcoins:
The term "bubble," in the financial context, generally refers to a situation where the price for an asset exceeds its fundamental value by a large margin.
During a bubble, prices for a financial asset or asset class are highly inflated, bearing little relation to the intrinsic value of the asset.
The terms "asset price bubble," "financial bubble" or "speculative bubble" are interchangeable and are often shortened simply to "bubble."
Bubble Characteristics:
A basic characteristic of bubbles is the suspension of disbelief by most participants during the "bubble phase."
There is a failure to recognize that regular market participants and other forms of traders are engaged in a speculative exercise which is not supported by previous valuation techniques.
Also, bubbles are usually identified only in retrospect, after the bubble has burst.
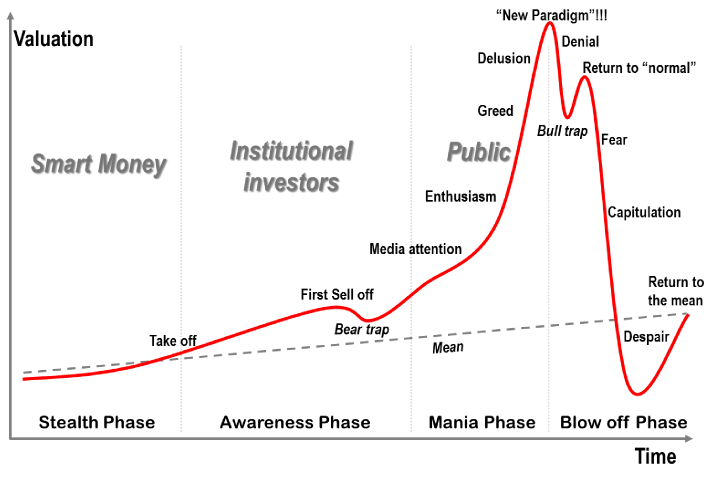
In most cases, an asset price bubble is followed by a spectacular crash in the price of the securities in question. In addition, the damage caused by the bursting of a bubble depends on the economic sector/s involved, and also whether the extent of participation is widespread or localized.
For example, the bursting of the 1980s bubble in Japan led to a prolonged period of stagnation for the Japanese economy.
But since the speculation was largely confined to Japan, the damage wrought by the bursting of the bubble did not spread much beyond its shores.
On the other hand, the bursting of the U.S. housing bubble triggered record wealth destruction on a global basis in 2008, because most banks and financial institutions in the U.S. and Europe held hundreds of billions of dollars worth of toxic subprime mortgage-backed securities.
By the first week of January, 2009, the 12 largest financial institutions in the world had lost half of their value. The economic downturn had caused many other businesses in various industries to either go bankrupt or seek financial assistance.
The Dutch Tulip Mania
To this day, the Dutch tulip mania remains the yardstick by which speculative bubbles are measured, because of the total disconnect between the fundamental value of a tulip and the price that a prized specimen could fetch in Holland in the 1630s.
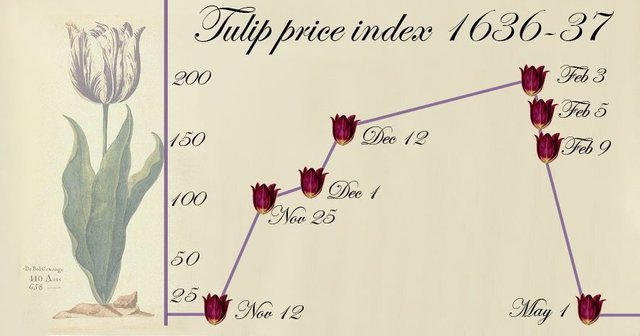
The vivid colors of tulips and the seven years it takes to grow them led to their increasing popularity among the Dutch in the 1600s. As demand for them grew, tulip prices rose, and professional growers became willing to pay increasingly higher prices for them.
Tulip mania peaked in 1636-37, and tulip contracts were selling for more than 10-times the annual income of skilled craftsmen.
The tulip bubble collapsed from February 1637. Within months, tulips were selling for 1/100th of their peak prices.
Minsky's Theory of Financial Instability
The economist Hyman P. Minsky is certainly no household name. However, thanks to the credit crisis and recession of 2008-09, Minsky's theory of financial instability attracted a great deal of attention and gathered an increasing number of adherents more than a decade after his passing in 1996.

Minsky was one of the first economist to explain the development of financial instability and its interaction with the economy.
His book, "Stabilizing an Unstable Economy" (1986) was considered a pioneering work on this subject. (To learn more, refer to Riding The Market Bubble: Don't Try This At Home.)
Five Steps of a Bubble
Minsky identified five stages in a typical credit cycle – displacement, boom, euphoria, profit taking and panic. Although there are various interpretations of the cycle, the general pattern of bubble activity remains fairly consistent.
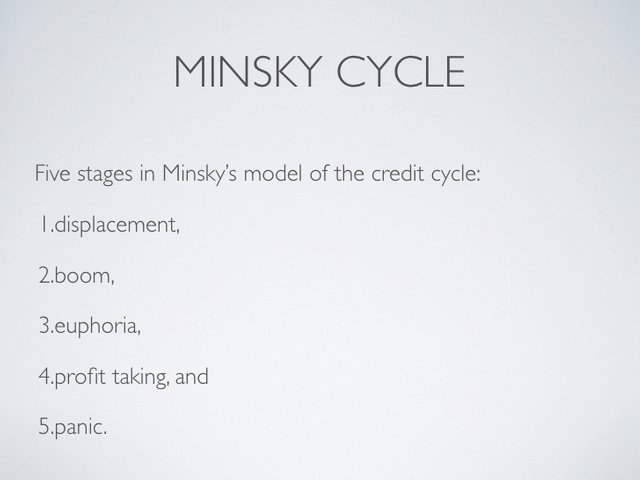
First Step - Displacement
A displacement occurs when investors get enamored by a new paradigm, such as an innovative new technology or interest rates that are historically low.
A classic example of displacement is the decline in the federal funds rate from 6.5% in May, 2000, to 1% in June, 2003. Over this three-year period, the interest rate on 30-year fixed-rate mortgages fell by 2.5 percentage points to a historic lows of 5.21%, sowing the seeds for the housing bubble.
Second Step - Boom
Prices rise slowly at first, following a displacement, but then gain momentum as more and more participants enter the market, setting the stage for the boom phase.
During this phase, the asset in question attracts widespread media coverage. Fear of missing out on what could be an once-in-a-lifetime opportunity spurs more speculation, drawing an increasing number of participants into the fold.
Third Step - Euphoria
During this phase,caution is thrown to the wind, as asset prices skyrocket. The "greater fool" theory plays out everywhere.
Valuations reach extreme levels during this phase.
For example, at the peak of the Japanese real estate bubble in 1989, land in Tokyo sold for as much as $139,000 per square foot, or more than 350-times the value of Manhattan property.
After the bubble burst, real estate lost approximately 80% of its inflated value, while stock prices declined by 70%.
Similarly, at the height of the internet bubble in March, 2000, the combined value of all technology stocks on the Nasdaq was higher than the GDP of most nations.
During the euphoric phase, new valuation measures and metrics are touted to justify the relentless rise in asset prices.
Fourth Step - Profit Taking
By this time, the smart money – heeding the warning signs – is generally selling out positions and taking profits.
But estimating the exact time when a bubble is due to collapse can be a difficult exercise and extremely hazardous to one's financial health, because, as John Maynard Keynes put it, "the markets can stay irrational longer than you can stay solvent."
Note that it only takes a relatively minor event to prick a bubble, but once it is pricked, the bubble cannot "inflate" again.
In August, 2007, for example, French bank BNP Paribas halted withdrawals from three investment funds with substantial exposure to U.S. subprime mortgages because it could not value their holdings.
While this development initially rattled financial markets, it was brushed aside over the next couple months, as global equity markets reached new highs. In retrospect, this relatively minor event was indeed a warning sign of the turbulent times to come.
Final Step - Panic
In the panic stage, asset prices reverse course and descend as rapidly as they had ascended. Investors and speculators, faced with margin calls and plunging values of their holdings, now want to liquidate them at any price.
As supply overwhelms demand, asset prices slide sharply.
One of the most vivid examples of global panic in financial markets occurred in October 2008, weeks after Lehman Brothers declared bankruptcy and Fannie Mae, Freddie Mac and AIG almost collapsed.

The S&P 500 plunged almost 17% that month, its ninth-worst monthly performance. In that single month, global equity markets lost a staggering $9.3 trillion of 22% of their combined market capitalization.
Anatomy of a Stock Bubble
Numerous internet-related companies made their public debut in spectacular fashion in the last 1990s before disappearing into oblivion by 2002.
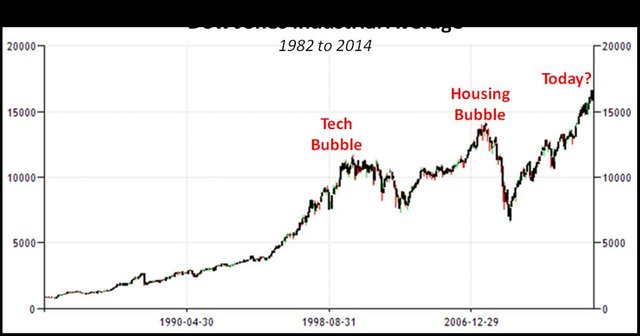
In May, 1999, with the internet revolution in full swing, eToys had a very successful initial public offering, where shares at $20 each escalated to $78 on their first trading day.
The company was less than three years old at that point, and had grown sales to $30 million for the year ended March 31, 1999, from $0.7 million in the preceding year.
Investors were very enthusiastic about the stock's prospects, with the general thinking being that most toy buyers would buy toys online rather than at retail stores such as Toys "R" Us. This was the displacement phase of the bubble.
Shortly afterwards, eToys fell 9% on concern that potential sales by company insiders could drag down the stock price, following the expiry of lockup agreements that placed restrictions on insider sales.
Trading volume was exceptionally heavy that day, at nine-times the three-month daily average.
The day's drop brought the stock's decline from its record high of $86 to 40%, identifying this as the profit-taking phase of the bubble.
By March, 2000, eToys had tumbled 81% from its October peak to about $16 on concerns about its spending. The company was spending an extraordinary $2.27 on advertising costs for every dollar of revenue generated.
Although the investors were saying that this was the new economy of the future, such a business model simply is not sustainable.
In July 2000, eToys reported its fiscal first-quarter loss widened to $59.5 million from $20.8 million a year earlier, even as sales tripled over this period to $24.9 million.
It added 219,000 new customers during the quarter, but the company was not able to show bottom-line profits. By this time, with the ongoing correction in technology shares, the stock was trading around $5.
Towards the end of the year, with losses continuing to mount, eToys would not meet its fiscal third-quarter sales forecast and had just four months of cash left.
The stock, which had already been caught up in the panic selling of internet-related stocks since March and was trading around at slightly over $1, fell 73% to 28 cents by February, 2001.
Since the company failed to retain a stable stock price of at least $1, it was delisted from the Nasdaq.
A month after it had reduced its workforce by 70%, eToys let go its remaining 300 workers and was forced to declare bankruptcy. By this time, eToys had lost $493 million over the previous three years, and had $274 million in outstanding debt.
As Minsky and a number of other experts opine, speculative bubbles in some asset or the other are inevitable in a free-market economy.
However, becoming familiar with the steps involved in bubble formation may help you to spot the next one and avoid becoming an unwitting participant in it.
Nice article genesis91, as someone who's slowly been investing more and more by the month, I am always on the lookout for new information to increase my knowledge base.
Thanks, @jae5086!
I think the bubble isn't anywhere close to bursting, but it's important to know how to see the signs when they occur.
very helpfull visioning mind. seeing out of box .
thank you.