Long EURCHF Trade
EURCHF traded within the 38.2 to 61.8% Fibonacci range during August 2018 to May 2019.
It may have bottomed at a support level around 1.096 following yesterdays ECB Presser and looks set for a retest of the 61.8% area with suggested profit targets approaching the 50 Period Daily Moving Average ( red line )
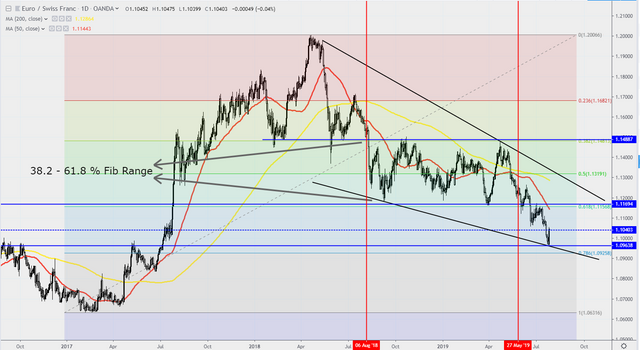
Link - https://www.tradingview.com/x/SqqMB3bg/
Whilst overbought on the 1 hour chart , you can look for better entries on lower RSI levels , retrace on a Fib Level or a break higher of a developing flag pattern.
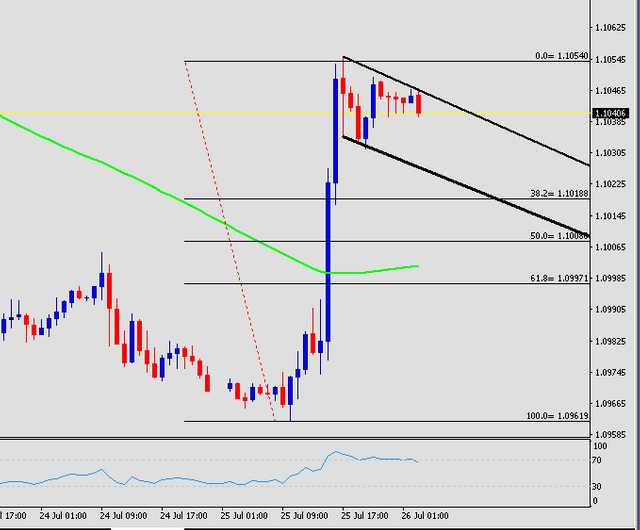
Hourly Chart
cheerio
FXcrypto