Bitcoin Update - Resistance Is In The Way
Resistance Holding Bitcoin Back -But For How Long?
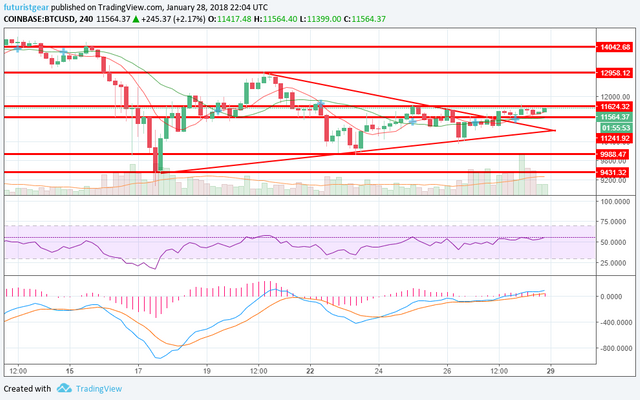
After breaking out of the triangle pattern yesterday, Bitcoin has been trading in a narrow range between 2 support/resistance levels as we can see here:
https://www.tradingview.com/x/uZ3xo9gP/
4 Hour Chart
The Bulls and the Bears clearly can't seem to make their minds up at the moment, but the indicators are all looking more Bullish than anything else.
- The MACD is bullish and above the signal line
- The RSI is showing good strength just above the 50 level, and
- The MA cross is still on the buying side of things.
Volume is still a little low, but if the indicators remain on the bullish side, and if we also see volume picking up, we could soon break the resistance level at around $11,624 (it did earlier today, but only briefly).
If that level can be cleared, a rally to just under $13,000 could be on the cards!
But what do you think? Am I being overly bullish right now? Could another dip be coming? Let me know below!
Thanks for viewing & enjoy the rest of your Sunday!
(unless it's already Monday where you are of course)
For more technical analysis and crypto related posts, see also: @toofasteddie, @gazur, @ew-and-patterns, @pawsdog, @cryptomagic, @exxodus, @beiker, @allthereisislove, @lordoftruth, @masterthematrix, @cryptoheads, @tombort, @maarnio, @steemaze & @briggsy
Not intended as investment, financial, or trading advice.
Definitely seems like it is ready for a bit of a breakout. Low fees right should help bring some new money in.
Seems to have a had a bit of a breakdown if anything so far today. XD
I still think things are looking pretty bullish though, although I've just read something by someone who thinks a move to the crash lows could be on the cards.
We'll have to wait and see I guess! :-D