Bitcoin: This Support Better Holds
In my 2 previous posts, the latest was Bitcoin: After a Crash Comes a Melt Down ?, i focus on very short term view. It's basically the zone within my proverbial purple falling channel.
If i stand back and cast my eyes just a little wider. I would see this trend line with 4 important supports ("A" to "'D").
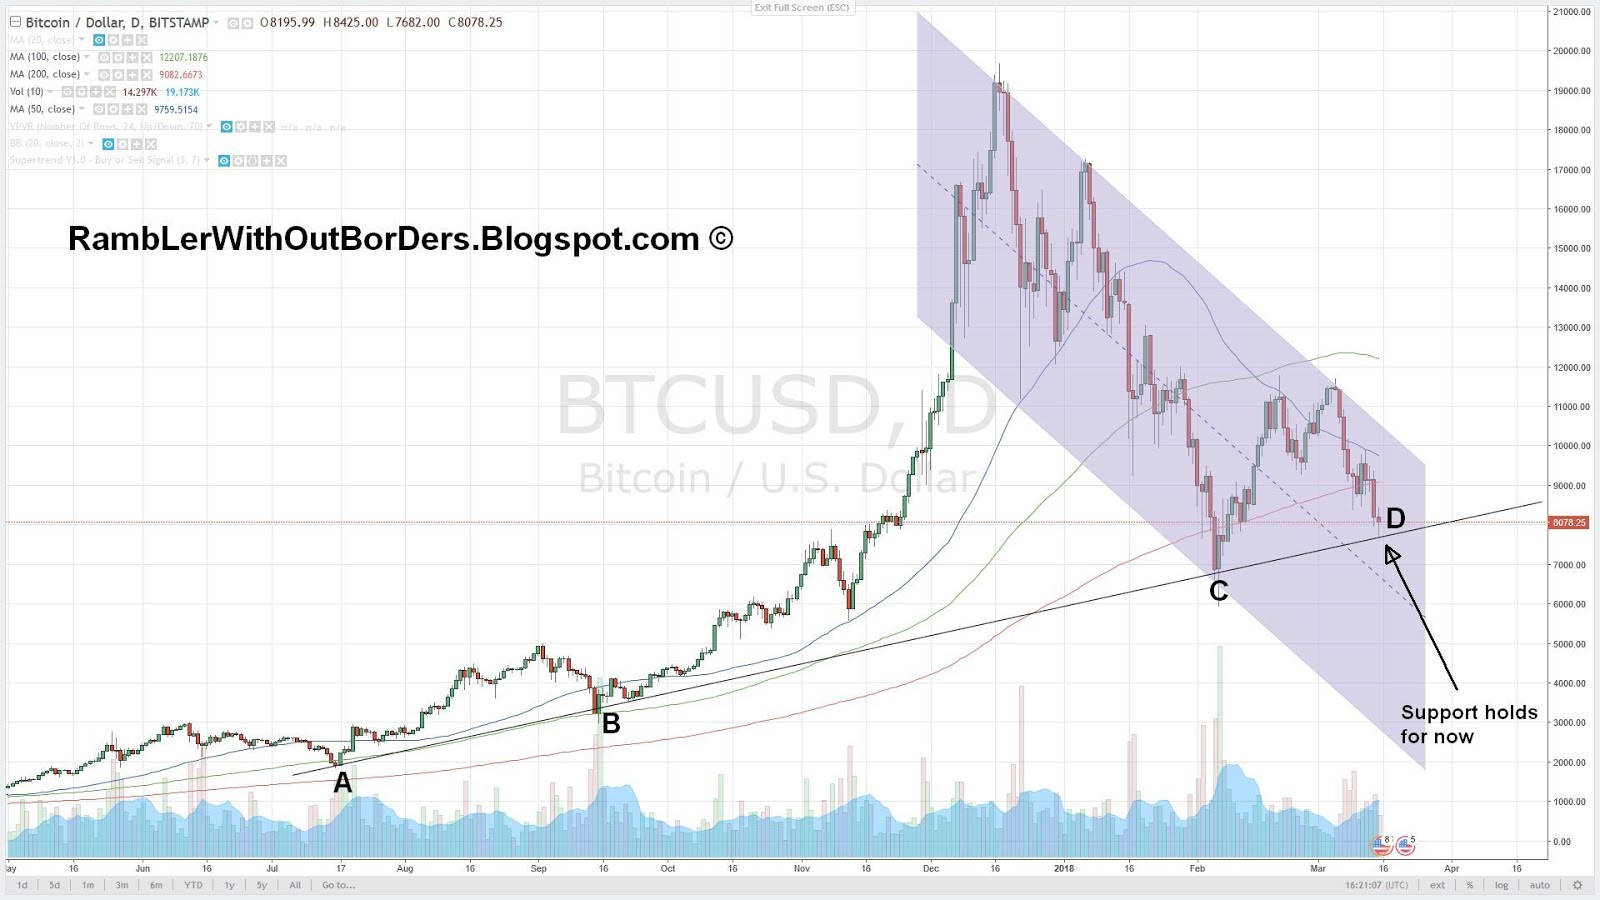
As i'm typing this, the price bounces off support at "D". This is clearly a critical support. This trend line gives support at "C" to form the bottom YTD after a ~70% drop from ATH in Dec 2017.
After it bounces off "C", it rises as much as 70% (which is nothing in Bitcoin market. But relief rally tends to be impressive). But it hit the upper purple falling channel, and the price is now once again coming to kiss this support. If this support at "D" fails this time, price could drop considerably. Quite easily toward the bottom channel of my purple falling channel.
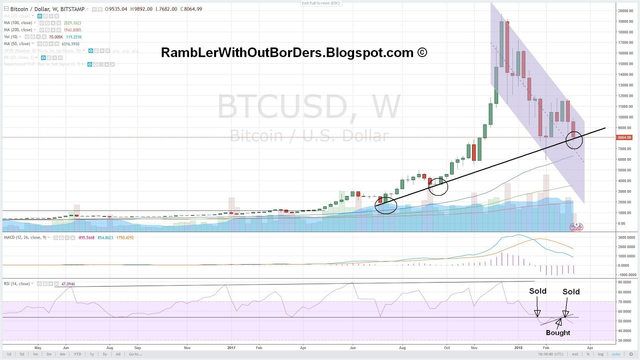
I explained in my previous posts (4 posts before) that i entered and exited my 3 trades during last month and this month based on the RSI on the WEEKLY chart.
Now that the weekly RSI has broken below the horizontal line that had held since Oct 2015, it suggests to me pretty negative technical sentiment. This gives me the feeling that the Bitcoin price probably wouldn't hold this support at "D". Also we've something developing right now that looks like a head & shoulders formation.
We only need to wait for a few days to confirm if prices will hold this important support or not. If it doesn't, the moving averages of the weekly chart would probably provide some support. It could gets to the bottom support of my purple falling channel. But it's too early to say that.