Collective Bitcoin Technical Analysis [1 August 2018]

A no bulshit Bitcoin summary aggregated from Tone Vays, Alessio Rastani, Tyler Jenks, Blog Prezesa, for all of you who have no time to watch their insightful videos.
~ NEW ~
Tone Vays [1 August 2018]
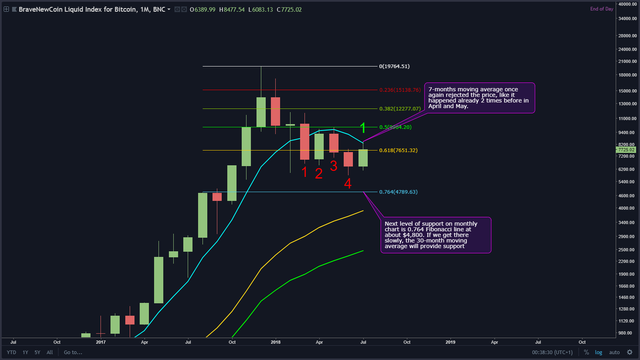
7-months moving average once again rejected the price, like it happened already 2 times before in April and May. Next level of support on monthly chart is 0.764 Fibonacci line at about $4,800. If we get there slowly, the 30-month moving average will provide support. source
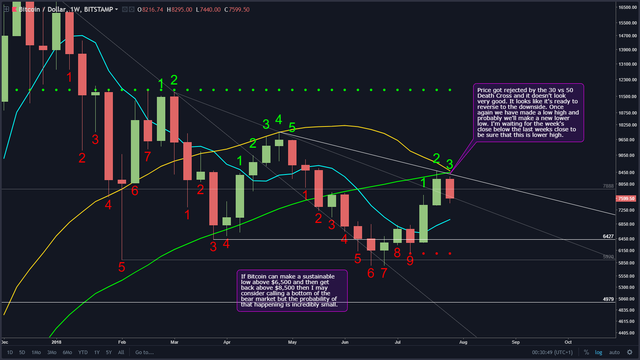
Price got rejected by the 30 vs 50 Death Cross and it doesn't look very good. It looks like it's ready to reverse to the downside. Once again we have made a low high and probably we'll make a new lower low. I'm waiting for the week's close below the last weeks close to be sure that this is lower high.
If Bitcoin can make a sustainable low above $6,500 and then get back above $8,500 then I may consider calling a bottom of the bear market but the probability of that happening is incredibly small. source
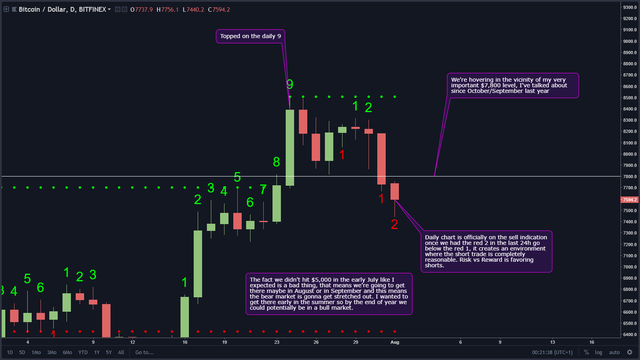
Daily chart is officially on the sell indication once we had the red 2 in the last 24h go below the red 1, it creates an environment where the short trade is completely reasonable. Risk vs Reward is favoring shorts. We've topped on the daily 9, which is nice, and we're hovering in the vicinity of my very important $7,800 level, I've talked about since October/September last year
The fact we didn't hit $5,000 in the early July like I expected is a bad thing, that means we're going to get there maybe in August or in September and this means the bear market is gonna get stretched out. I wanted to get there early in the summer so by the end of year we could potentially be in a bull market. source
~ CURRENT VIEW ~
Alessio Rastani [30 July 2018]
Bitcoin is currently in very similar situation like Gold was in 2013, when after three failed rallies price finally broke through it's key support level (Market Structure) and fell well below it. Alessio believes that this is Bitcoin's last chance, it's 3rd rally that must not fail if it doesn't want to share Gold's fate, he does believe that this is a beginning of an upward trend and a BULL market. But if Bitcoin was going to come back down to it's key support level, and he doesn't believe that it will, BUT IF it was, it will break through it and potentially go to $5,000 or maybe even as low as $3,000.
"Markets can be very generous at giving you 2nd and 3rd chances… but they are stingy with 4th and 5th chances" source
Tyler Jenks [27 July 2018]
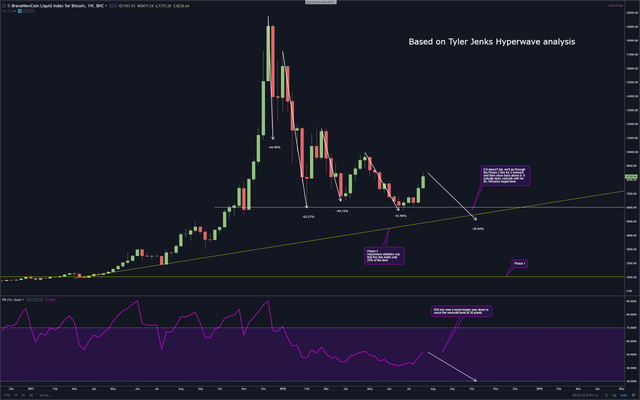
On the WEEKLY time scale his current view is BEARISH. Nothing has changed, both SAR and BB are still pretty much the same as they were. The RSI has risen a little to about 52 but it only means that it'll have a longer way down, meaning that the drop will be larger and will last longer until the oversold region is reached. He believes that we'll drop at least to the Phase 2 line of his Hyperwave, which is going to be at around $5,100 within the next 5 weeks. If it doesn't hold and we break through it, then this Hyperwave has failed and there is no other support levels below and the drop to the Phase 1 line at $1,000 is quite likely. source
Is it possible that this is the ultimate bottom of the Hyperwave at $5,700? Yes it's possible, but Tone Vays has given it 5 or 10%. Tyler doesn't believe it's a probable bet, not even a reasonable possible bet, but it is possible, so he gives it 10, maybe even as high as 20% chances. source
On a DAILY time scale his current view is NEUTRAL he thinks that a one more try of an upswing is possible from the most recent 4 daily candles formation where a recent down trending channel has formed in the last 3 days.
Blog Prezesa [23 July 2018]
Bounce we are in since the 16th of July is probably only a correction,it will be short lived and we'll soon continue moving downwards again. Recent Altcoins weakness suggest that the most of the money has been moved to Bitcoin. It's worth mentioning that in 2015 during the previous bubble formation, in the beginning only Bitcoin was gaining for a long time before Dash joined in and after that again it took awhile for the rest of the coins to joined the party. This is quite similar to what's happening at the moment, it may be a normal behaviour for this market, first Bitcoin is pumped and when there is a lot of cash already in it, it'll start spilling over the rest of the Alts, so this could mean a possibility of a change in a trend. source
My two cents on the matter
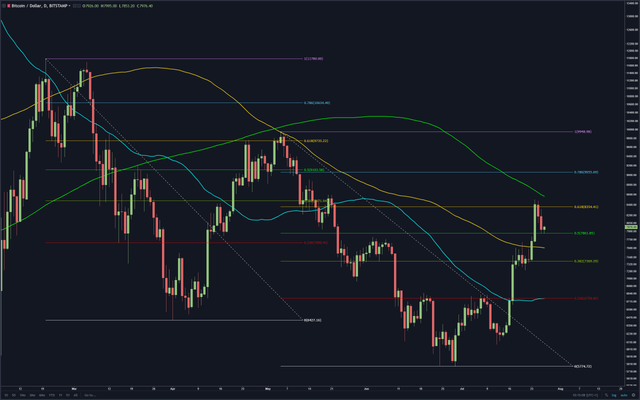
So far this recent bounce we're in since the end of June looks very much like the previous one from the 5th of May and in both cases price has bounced of 200-day moving average reaching just slightly over Fibonacci's Golden Ratio 0.618 level. In my opinion, I think that just like on the previous two occasions, we're going to drop back down from it and this time we're going to break through the $6,000 level hard only to stop somewhere around $4,200 but before that I think we'll stop on Tone's $4,975 for some time.

