Bitcoin Technical Analysis 5th August 2018
Bitcoin technical analysis summary from Tone Vays, Alessio Rastani, Tyler Jenks and Blog Prezesa for all of you who have no time to watch their insightful videos.
Alessio Rastani [5th August 2018]
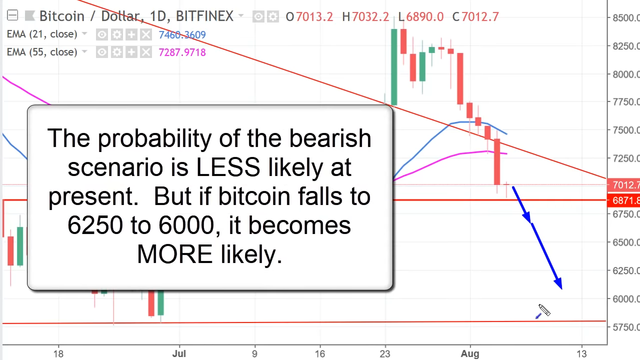
Currently he's still seeing it as a normal correction to a 0.618 Golden Ratio Fibonacci level WITHIN a beginning of a bullish trend though his confidence has been shaken a little. Probability of a bearish scenario is LESS likely but if bitcoin falls between $6,250 and $6,000 then it becomes MORE likely and we'll potentially see a big drop.
Blog Prezesa [2nd August 2018]
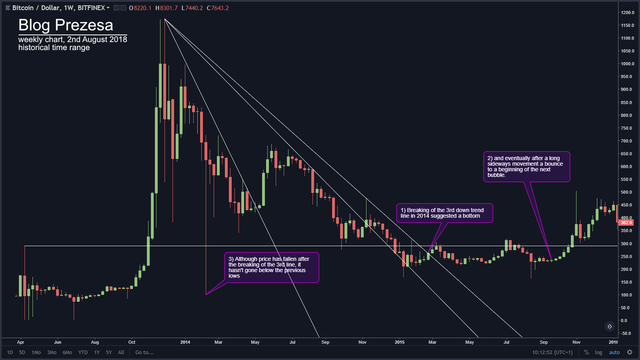
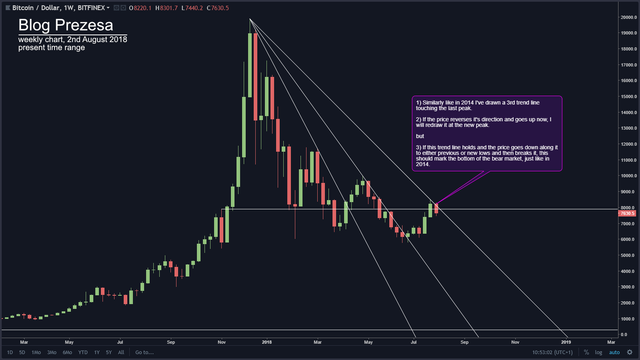
He compares what happened after the bubble in 2014 to the current situation. Back then when the price has finally broken through the 3rd trendline, it marked the end of the bear market and started a 6 months of sideways before it went into the next bubble. Price did go lower after the breaking of the 3rd trendline but never below the lowest low. He's pointing out similarities in our current situation and a possibility that we might just had our 3rd trendline established and this might be suggesting the upcoming bottom. source
Tone Vays [1st August 2018]
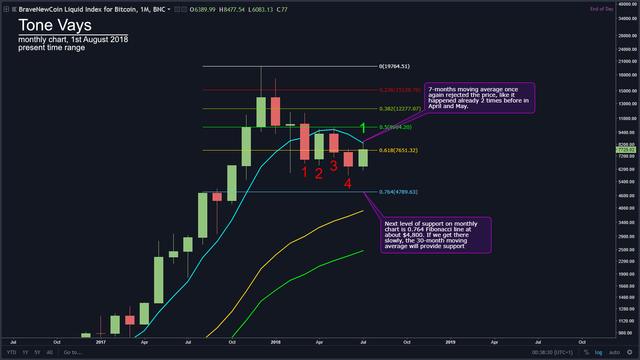
On the MONTHLY time frame, 7-months moving average once again rejected the price, like it happened already 2 times before in April and May. Next level of support on monthly chart is 0.764 Fibonacci line at about $4,800. If we get there slowly, the 30-month moving average will provide support.
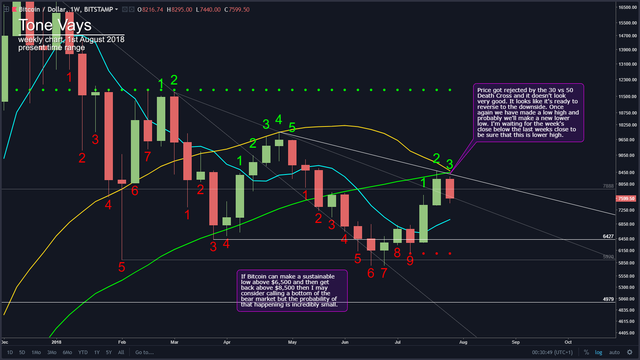
WEEKLY price got rejected by the 30 vs 50 Death Cross and it doesn't look very good. It looks like it's ready to reverse to the downside. Once again we have made a low high and probably we'll make a new lower low. I'm waiting for the week's close below the last weeks close to be sure that this is lower high. If Bitcoin can make a sustainable low above $6,500 and then get back above $8,500 then I may consider calling a bottom of the bear market but the probability of that happening is incredibly small.
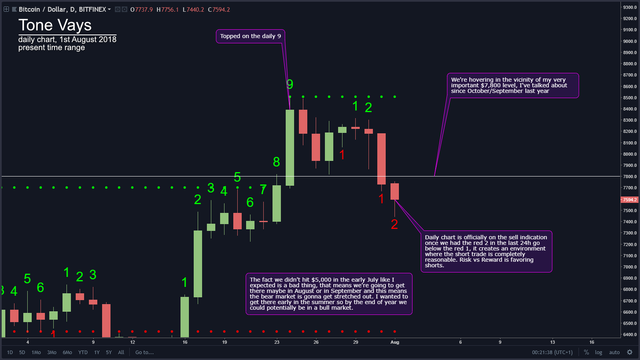
DAILY chart is officially on the sell indication once we had the red 2 in the last 24h go below the red 1, it creates an environment where the short trade is completely reasonable. Risk vs Reward is favoring shorts. We've topped on the daily 9, which is nice, and we're hovering in the vicinity of my very important $7,800 level, I've talked about since October/September last year. The fact we didn't hit $5,000 in the early July like I expected is a bad thing, that means we're going to get there maybe in August or in September and this means the bear market is gonna get stretched out. I wanted to get there early in the summer so by the end of year we could potentially be in a bull market. source
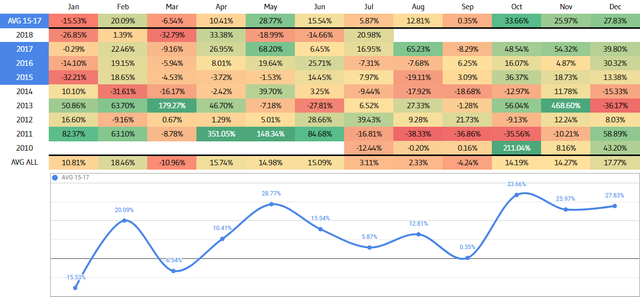
Bitcoin price Heath Map
