Bitcoin TA - summary of analysts - 19. Mar 18
Regular daily update on BTC ta analysts opinions.

My summary - sentiment: slightly bearish (last: bearish)

- It seems that we bounced again and got another chance. But that postpones the decision one more time probably into mid of April where the apex of the triangle is. So several weeks of uncertainty in front of us.
News about the blog
- None
Analysts key statements:
Tone:
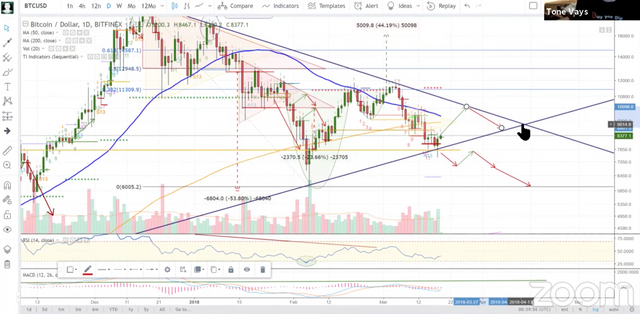
- Weekly: Weekly candle is weak (just closed). This week is in neutral zone.
- Daily: He didn't expected us to rebound that strong. He projection assumed that we close the daily candle below the support. That is proven wrong and invalidated.
He is assuming that we go up into the cross of the 50 and 200 MA. If we overcome that we get to 10'000 and hit the trend line. He thinks we get rejected there as a trend line is very strong at its 4th touch. So from there he is expecting a pull back into the apex of the triangle (around 8'400). That will happen around mid of April. That point is very significant and will give us direction. If we break out to the upside than he can see major buying coming in.
@ew-and-patterns:
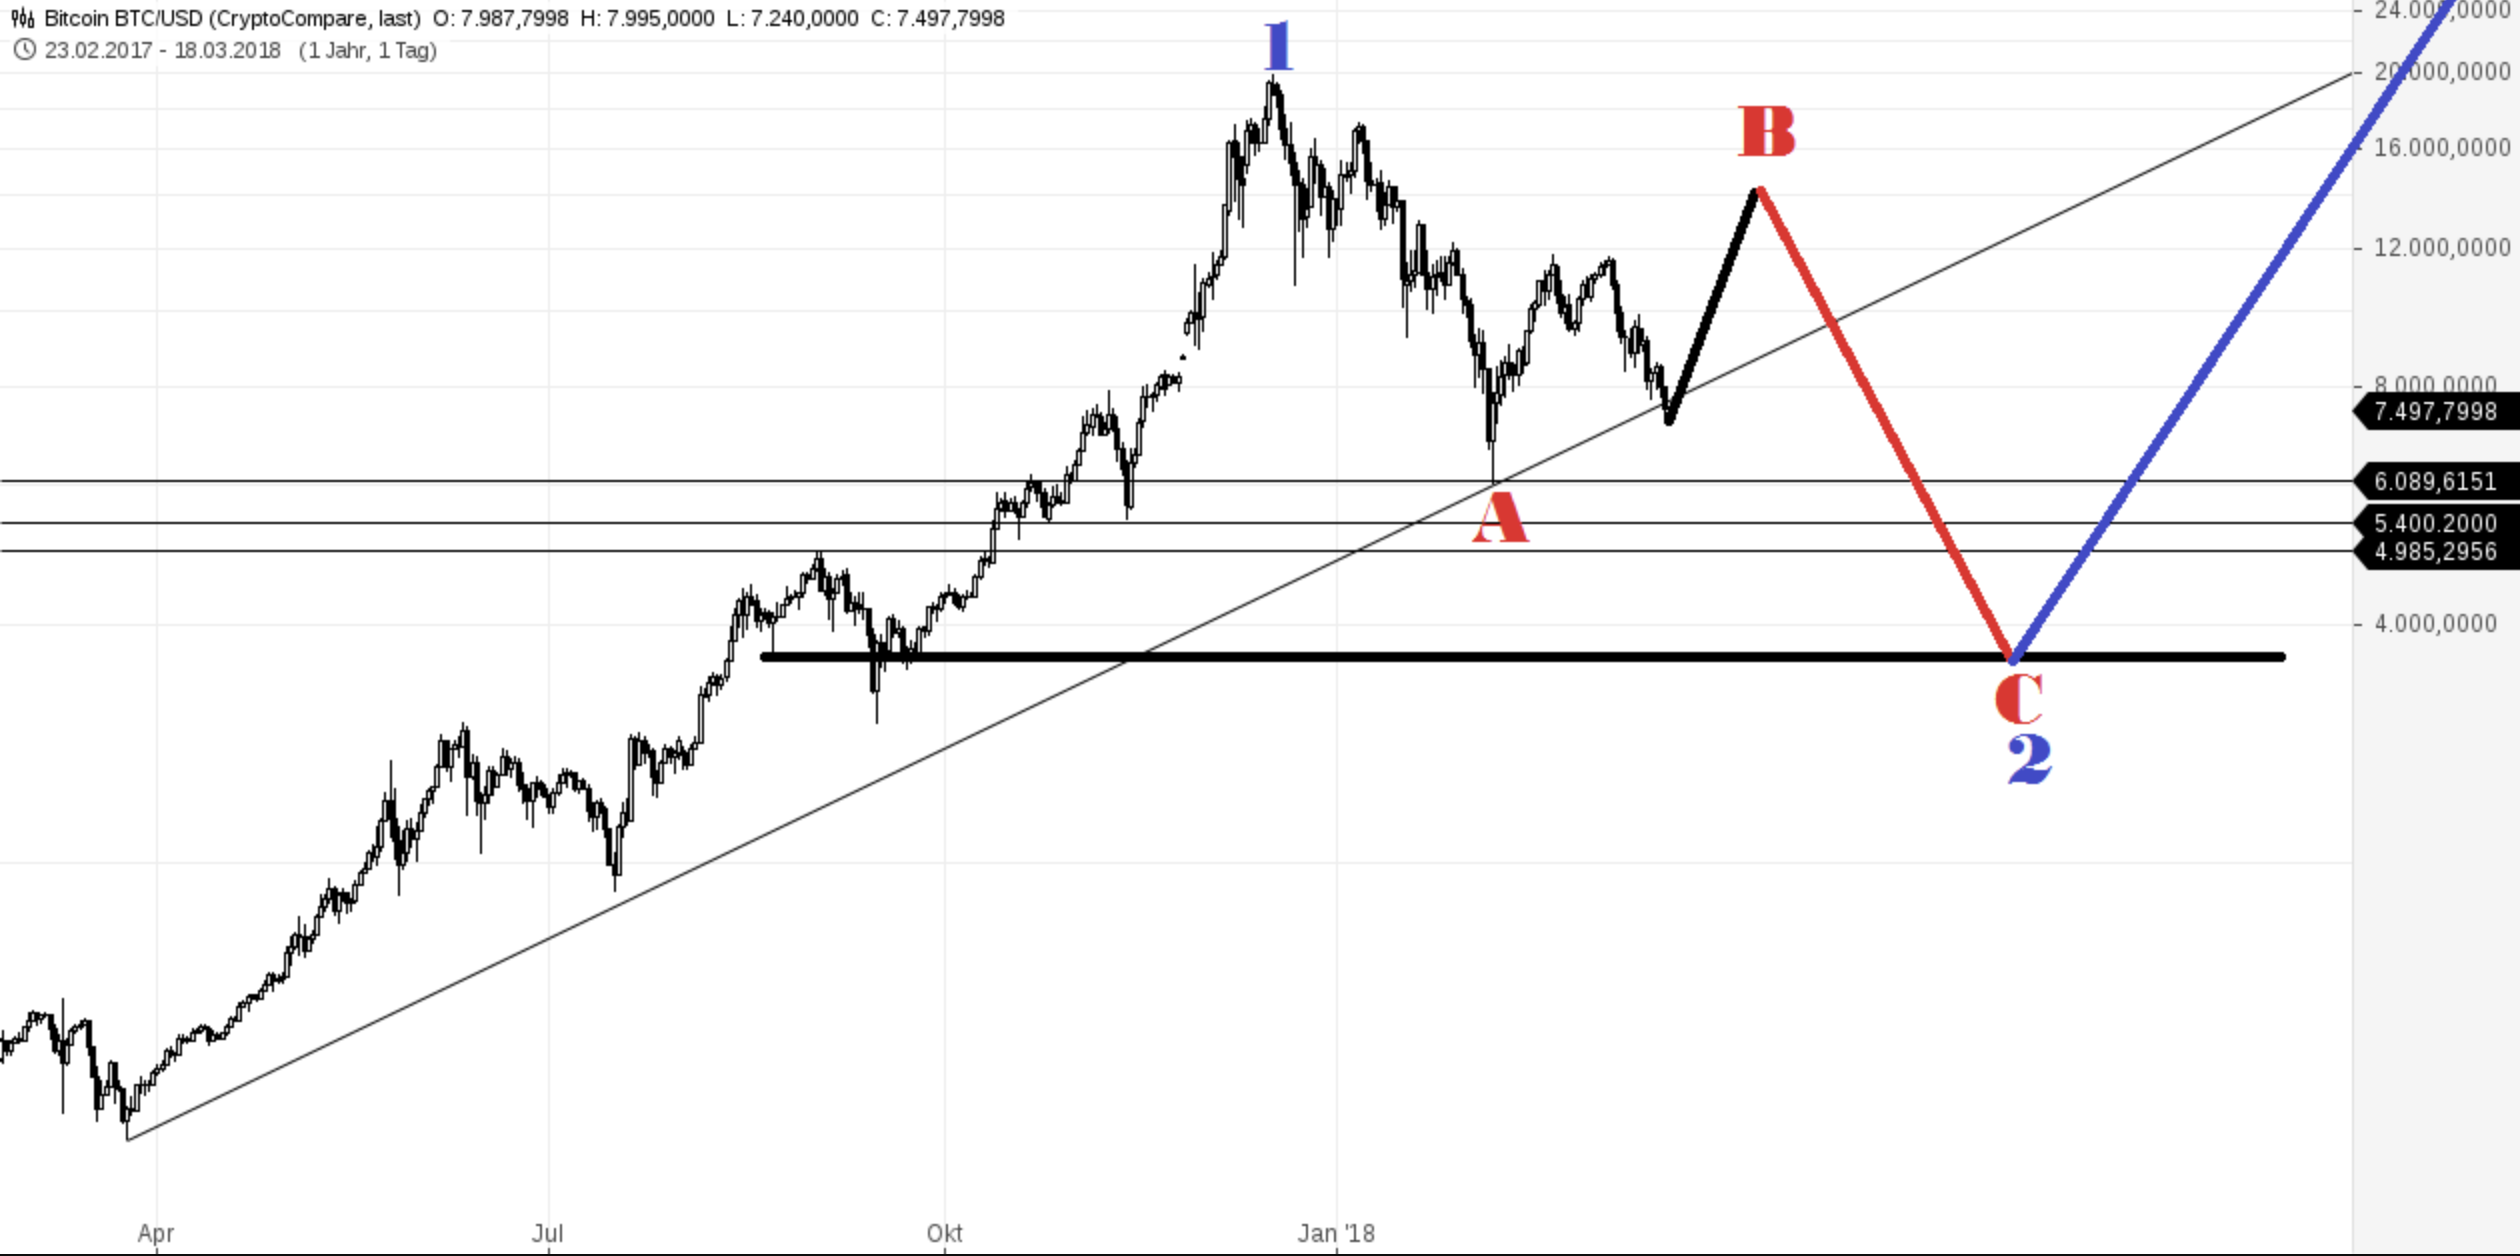
He presents an alternate count for awareness reasons. That one has a target for correction wave C of 4'000.
@lordoftruth:
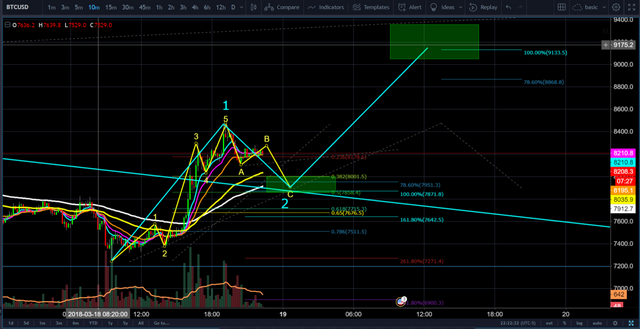
He sees his pattern confirmed. Strong buyers rushed in at 7'240. First impulse took us to 8'470 and he is expecting another push to 9'400. Todays trend is bullish. Expected trading for today is between 7'500 and 9'400.
@philakonesteemit:
We bounced strong but start loosing momentum. Probably correcting short term towards 8'000 region before going up to 9'100.
@passion-ground:
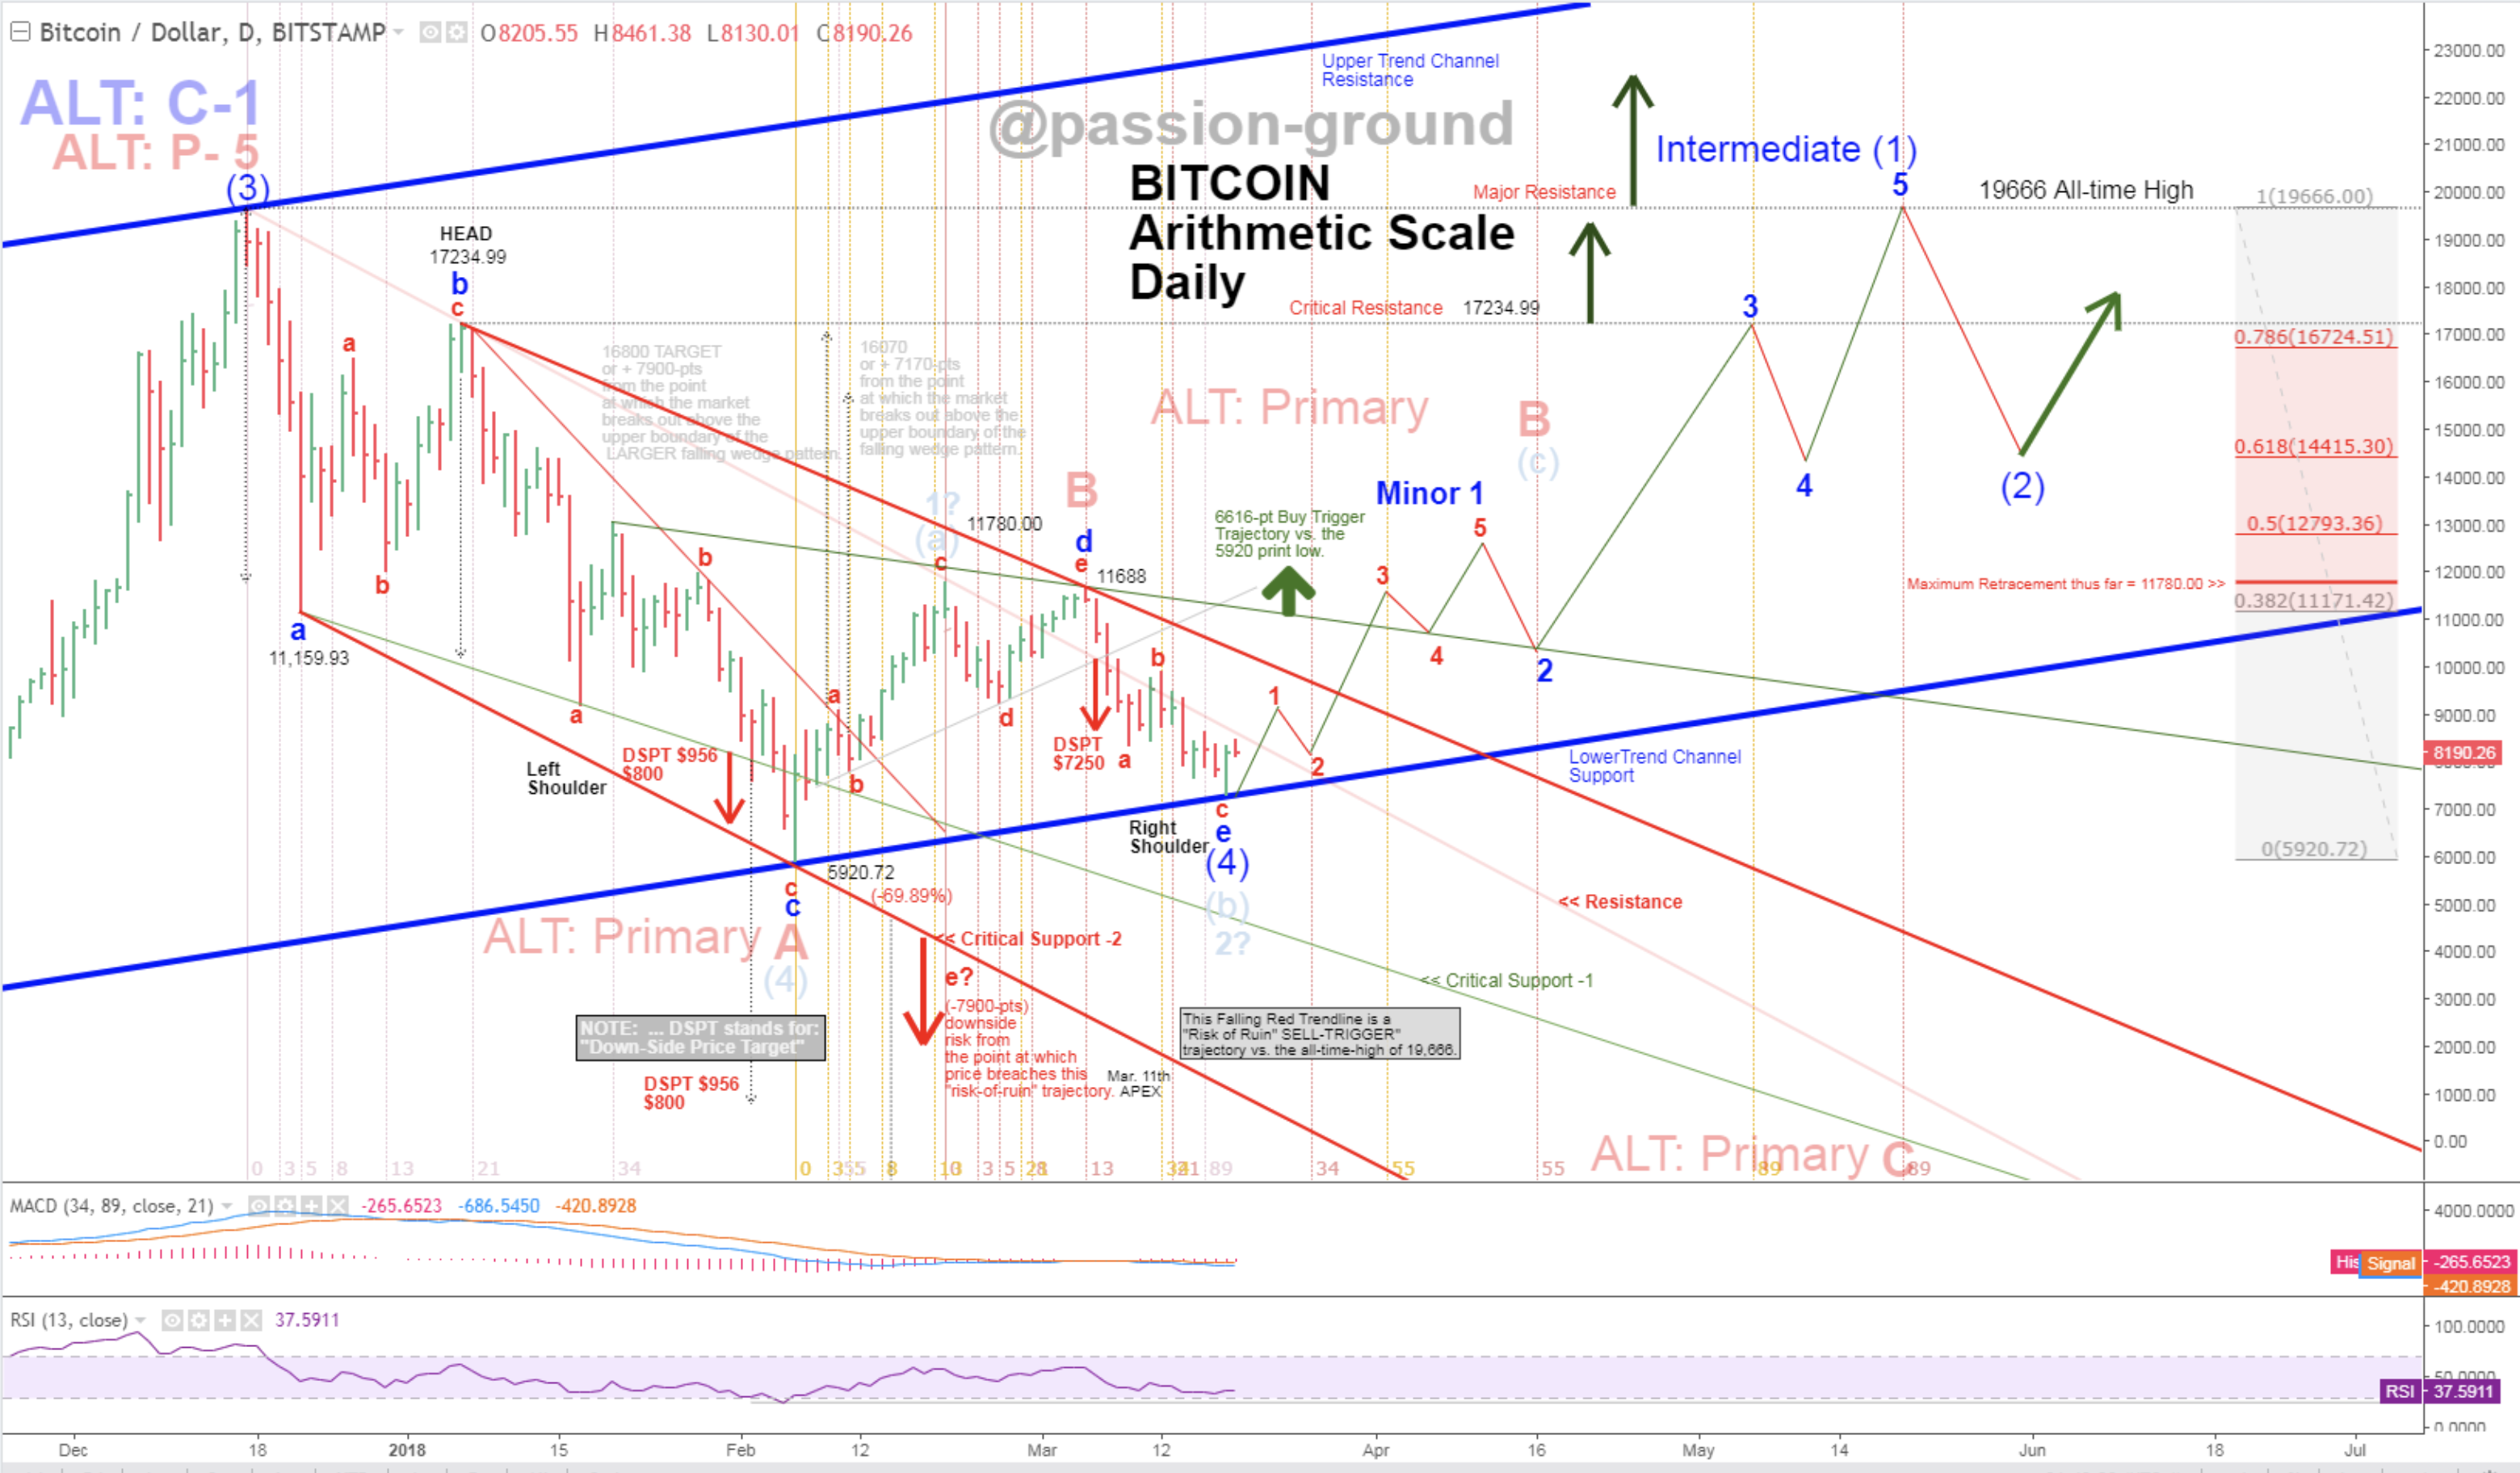
We met his long term standing target of 7'463. Great! He is now much less bearish but still sees 7'250 as his target. The 7250 level is one such target that continues to prevail, so long as 11,780 is able to hold as a standing pivot high of key import.
He sees wave c - e - (4) completed. From here he assumes a 5 wave impulse up - first towards 9'000ish correcting into the apex to around 8'000 followed by a break out to the upside above the downtrend. Apex at around 1st half of April.
Summary of targets/support/resistance


Reference table
| analyst | latest content date | link to content for details |
|---|---|---|
| Tone Vays | 19. Mar | here |
| @haejin | 19. Mar | here |
| @ew-and-patterns | 18. Mar | here |
| @lordoftruth | 19. Mar | here |
| @philakonesteemit | 19. Mar | here |
| @passion-ground | 19. Mar | here |
Definition
- light blue highlighted = all content that changed since last update.
- sentiment = how in general the analysts see the current situation (bearish = lower prices more likely / bullish = higher prices more likely)
- target = the next (short term) price target an analysts mentions. This might be next day or in a few days. It might be that an analyst is bullish but sees a short term pull-back so giving nevertheless a lower (short term) target.
- support/res(istance) = Most significant support or resistances mentioned by the analysts. If those are breached a significant move to the upside or downside is expected.
- bottom = -> now renamed and moved to long term table. Low 2018
- low/top 2018 = what is the low or the top expected for 2018?
Further links for educational purposes:
- From @ToneVays: Learning trading
- From @philakonecrypto: Like in every post you find links to his amazing educational videos. For example here
- From @lordoftruth: Fibonacci Retracement
- From @haejin: Elliott Wave Counting Tutorial
*If you like me to add other analysts or add information please let me know in the comments.
Yesterday was a wild ride! I was glad it went that way--
Yeah, it was a good one. We all had some fun and hope. 😉
I love your summary. They give a clear picture of some of the best analysts. And it is clear that there's no perfect play. Everyone guess different numbers.
Good post.
I Like your post.