BTC Update 18th Sept
BTC Update curtiousy of PAID TRADING (DZ871)
📈 # BTC
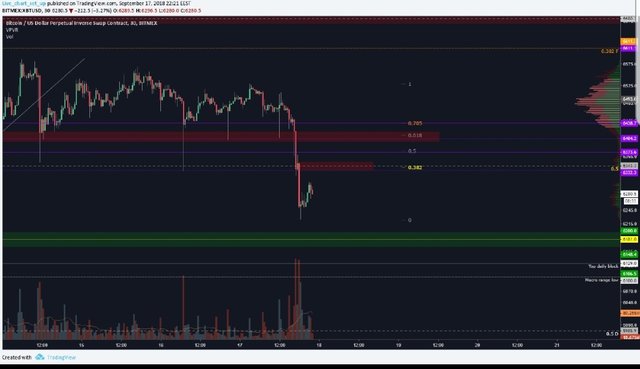
At the weekend, the price of Bitcoin pierced support 6427 a couple of times, but each time made attempts to break above the level of 6600.
Daily chart: the pair BTC-USD continues to remain bearish. The price remains well below the 200th and 50th moving averages. The bearish converging triangle, formed by the movement from the February lows and highs, remains in force. The key support for the bearish scenario is $ 6,000, overcoming which opens the way to annual lows and a further drop to 5500. However, on August 14 and September 9, rising local lows were established, which may indicate the depletion of the bearish trend.
The four-hour chart: the pair's price continues to move in the local uplink from the September 9 lows. The pair is trading above the 50th EMA, which creates support at 6485, and below the 200th EMA, which forms resistance at 6655. There is also an inclined resistance of the rising channel.
Time schedule: the pair is above the moving averages, in a narrow range near the level of 6500. To develop the bullish movement, it is required to overcome the levels 6580 and 6650 (slope resistance of the local uplink). The bearish scenario provides for a break first below the level of 6500, and then testing the level of 6300 (inclined support of the ascending channel).
Judging by the dying bullish impulses, this week we are expected to slip to the support area. If the bears manage to push the price below 6250.00 USD, then the pair will resume the downtrend, and then very soon the annual minimum will be updated.

@faith-zakia, I gave you a vote!
If you follow me, I will also follow you in return!
Common green market we will be happy if you will appear. But this news I know you will be happy https://www.kucoin.com/#/anniversary/overview
Great article, @faith-zakia!